Dashboards
Dashboards are interactive visual interfaces that consolidate and present key data points in a clear, accessible format. They enable users to monitor performance, uncover trends, and make informed decisions by visualizing complex datasets through charts, tables, and key performance indicators (KPIs).
Creating a dashboard
Within each workspace along with Workbooks module there are two modules specifically for BI: Visualizer and Dashboards. Each dashboard is independent to that workspace until externally shared. When you create a dashboard, you are building a single page to hold multiple widgets. This allows you to quickly visualize business intelligence through charts, graphs, and other data displays.
To create a dashboard, do the following:
-
Access a workspace and click Dashboard tab from the top.
-
From the bottom of left navigation panel, click Create page. The New Dashboard Page is displayed.
-
Enter a unique name and meaningful description for the dashboard.
-
Click Create.
-
Create a visualization/widget and pin the widget that to a dashboard. The Dashboards are then populated with widgets.
Editing dashboards
When you edit a dashboard, you can do the following:
- Change the layout of dashboards
- Edit widget data
- Delete the widgets in a dasbboard
- Duplicate a widget
Change the layout of dashboards
You can change the layout of your dashboards by changing the order of the widgets in the dashboard. Do the following:
-
From a workspace, on the top, click Dashboard and access a dashboard.
-
On the dashboard, from the upper right corner, click the Settings icon and then choose Manage Layouts & Widgets.
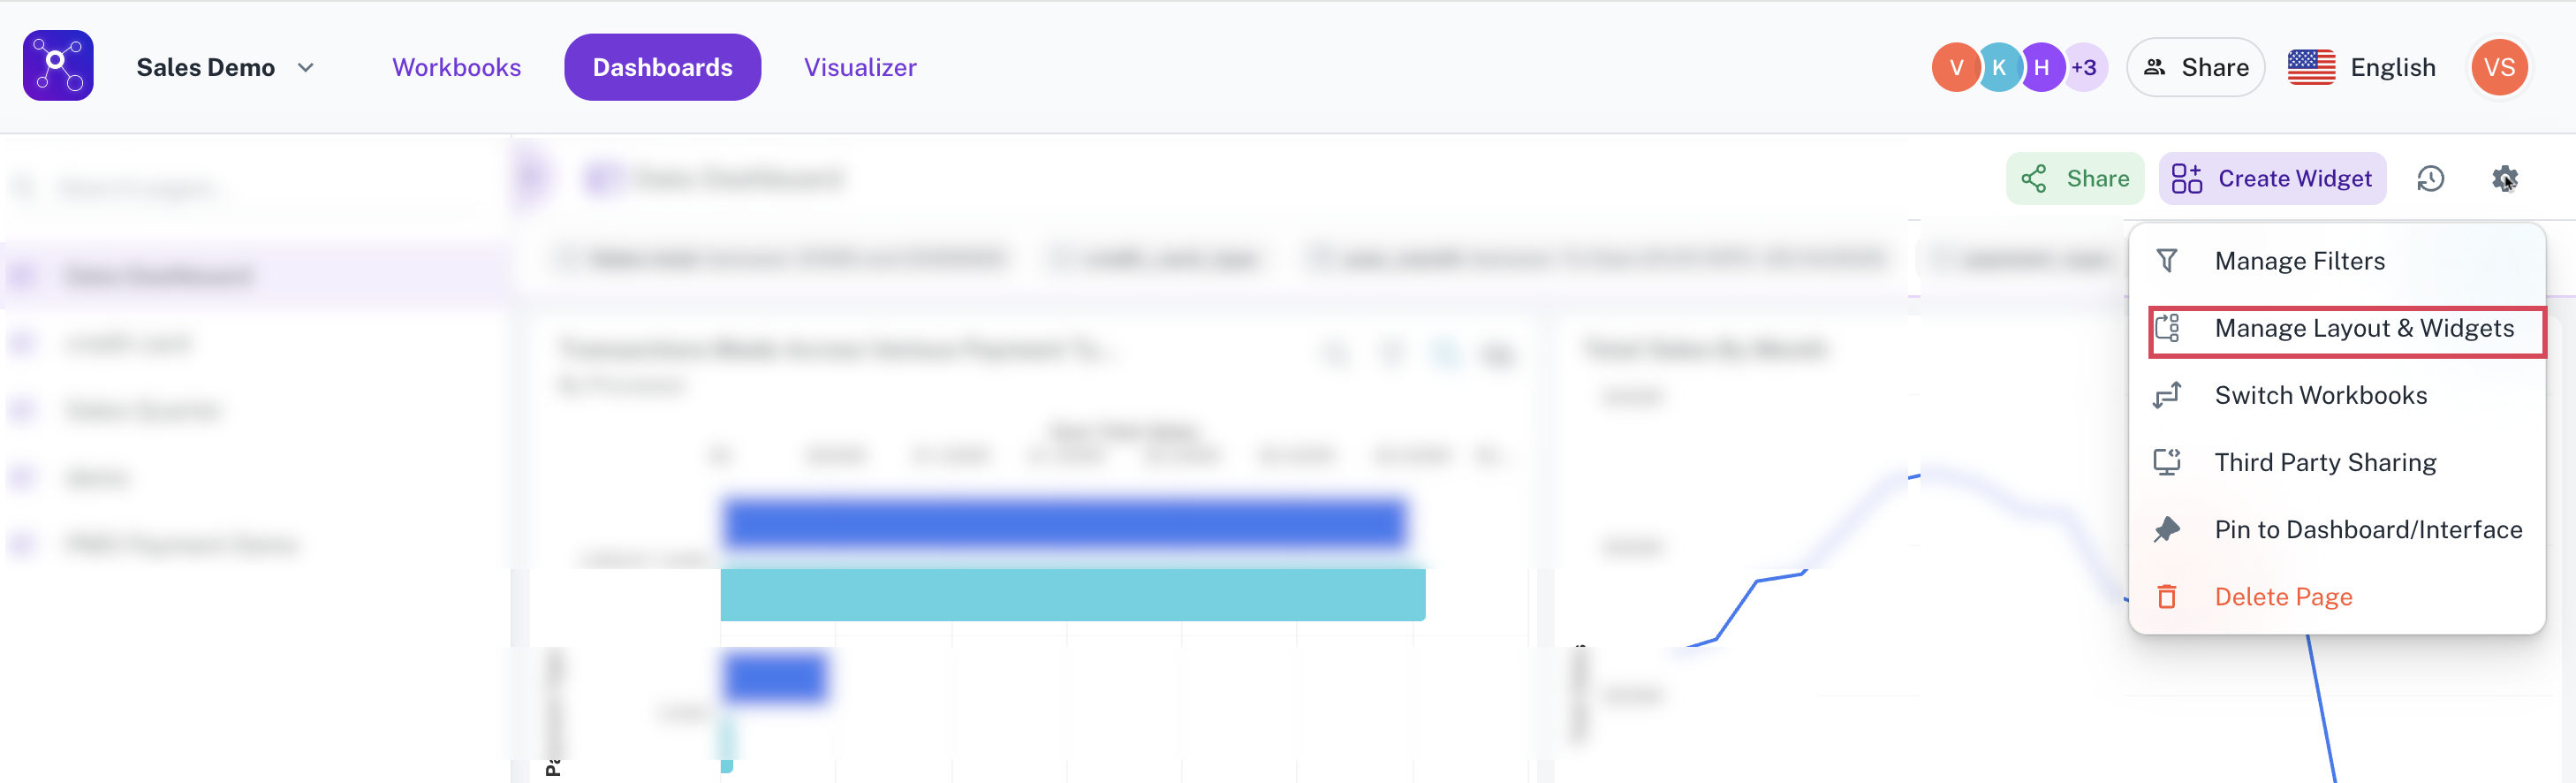
-
Edit the dashboard details or rearrange and edit the size of the layout of the widget by simply dragging and dropping to necessary size and place and then click the Save icon.
-
From the upper right corner, click Done button.
Editing widget data��
-
From a workspace, on the top, click Dashboard and access a dashboard you want to edit.
-
On the dashboard, from the upper right corner, click the Settings icon and then choose Manage Layouts & Widgets.
-
Hover over any widget that you want to edit and select the edit icon under that widget.
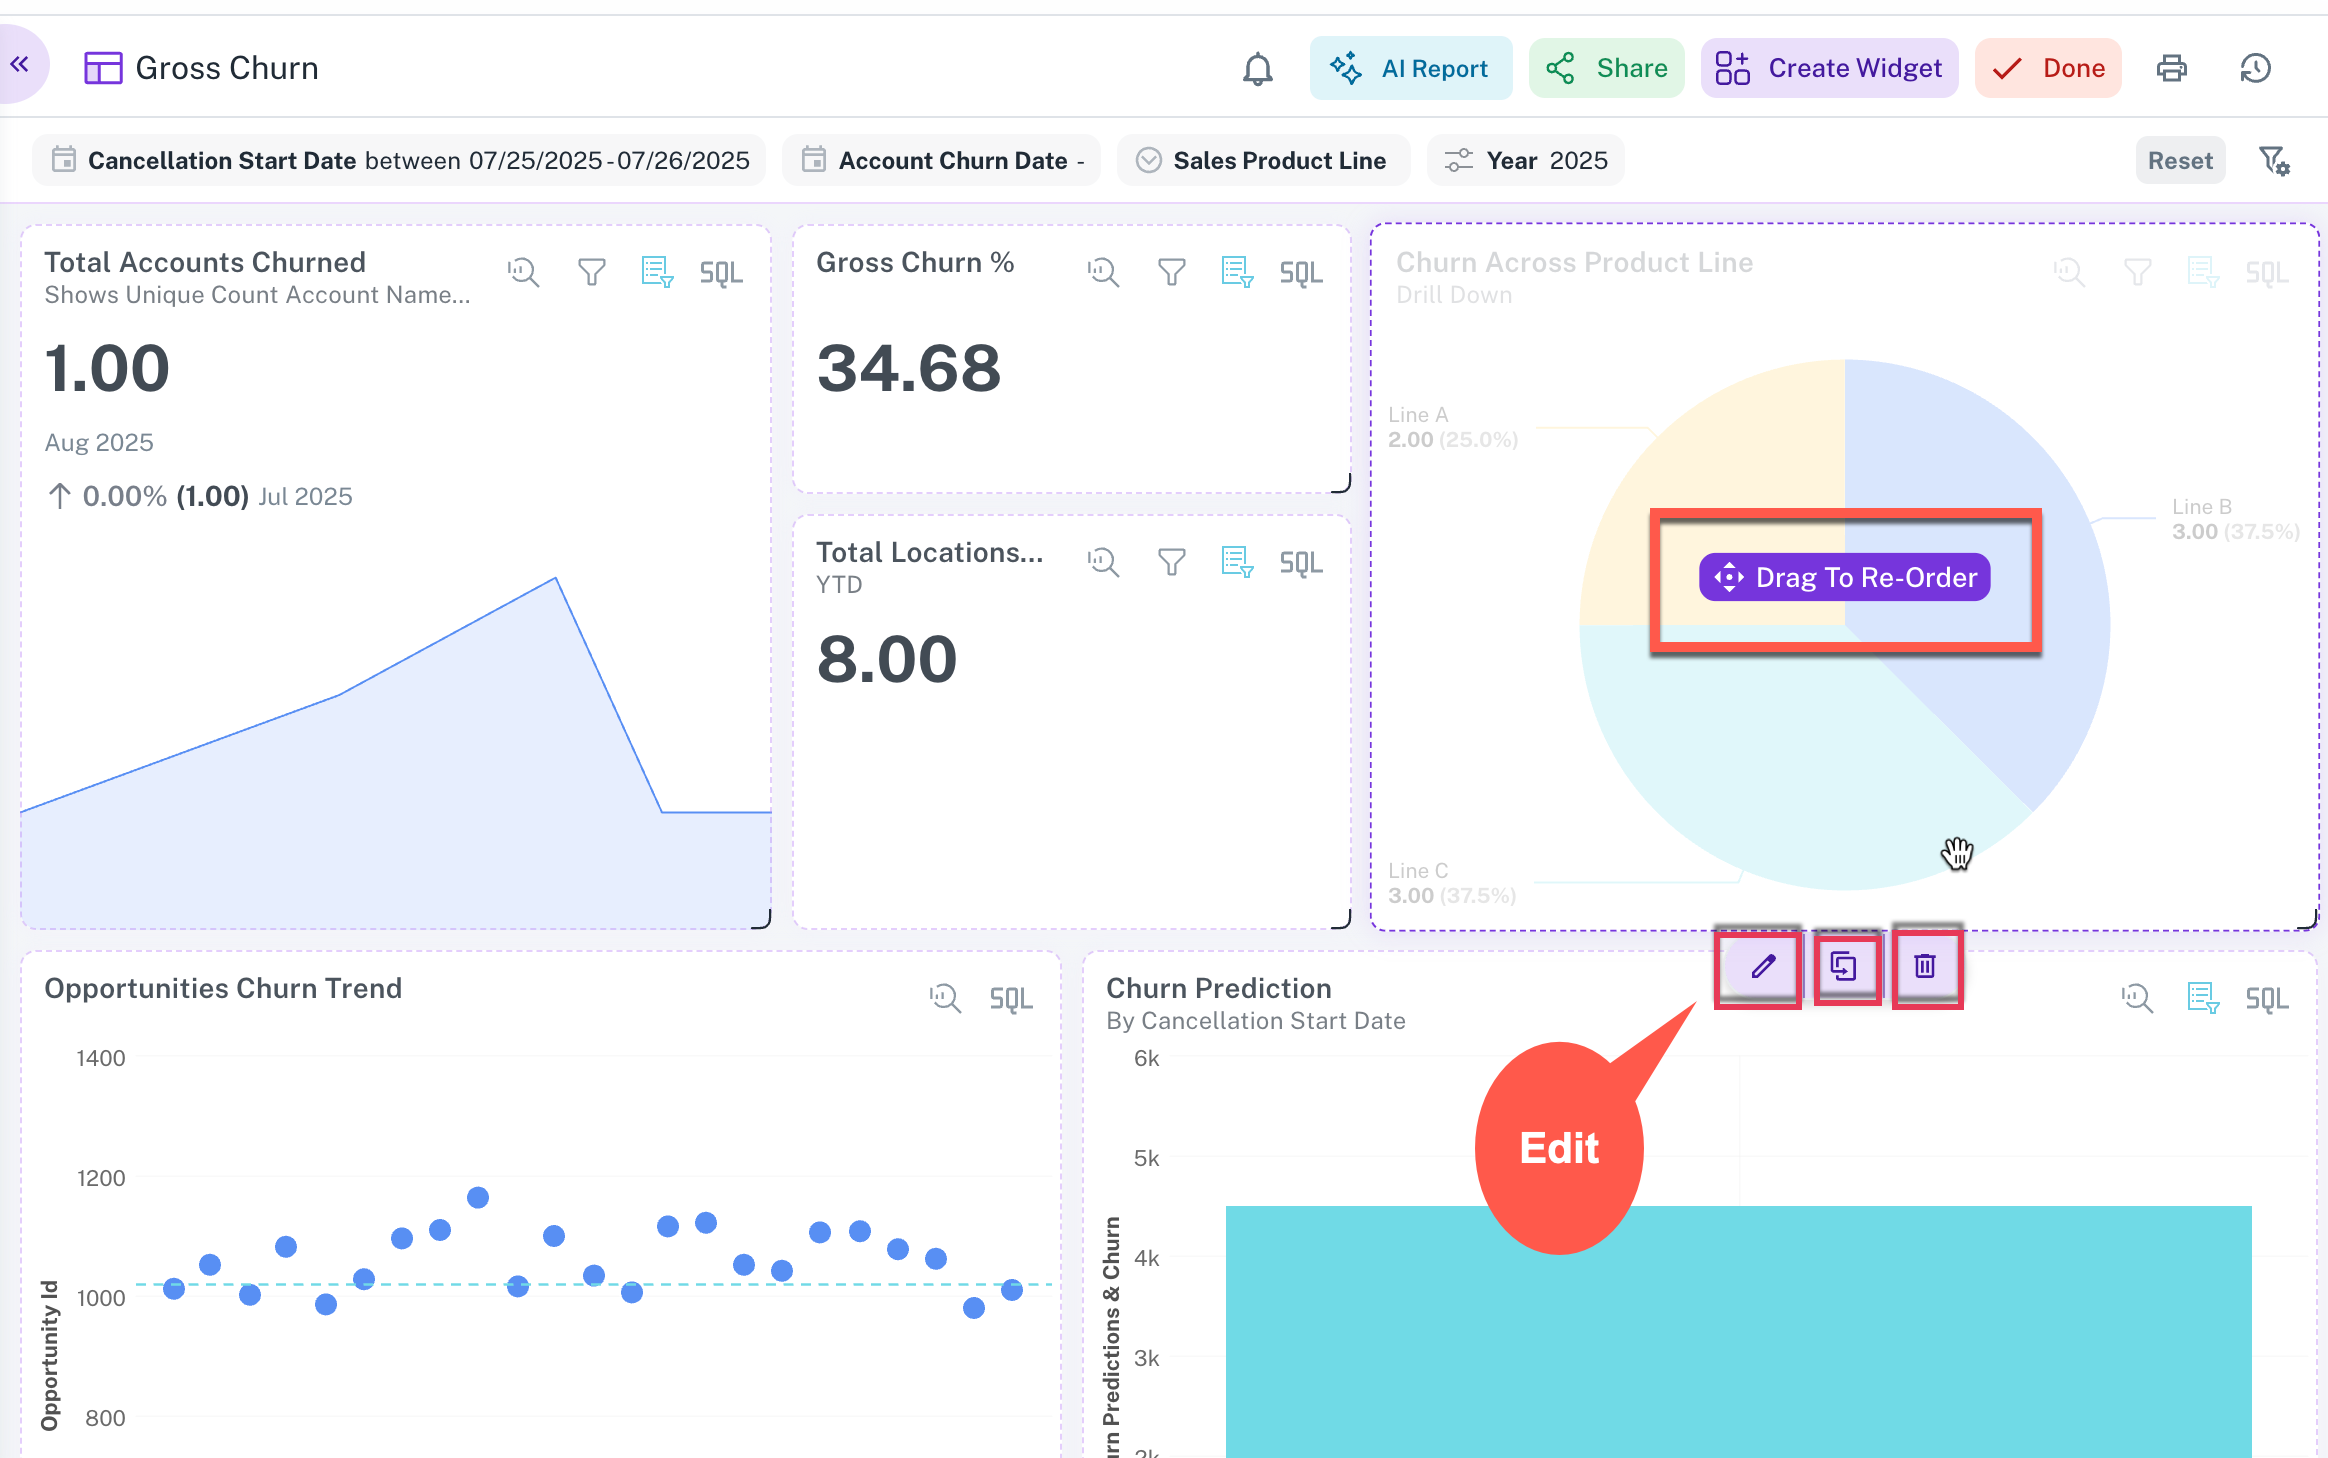
-
Make changes to your chart and click Save button on the chart. and then click Done.
Deleting a widget in the dashboard
-
From a workspace, on the top, click Dashboard and access a dashboard you want to edit.
-
On the dashboard, from the upper right corner, click the Settings icon and then choose Manage Layouts & Widgets.
-
Hover over any widget that you want to delete and select the delete icon under that widget.
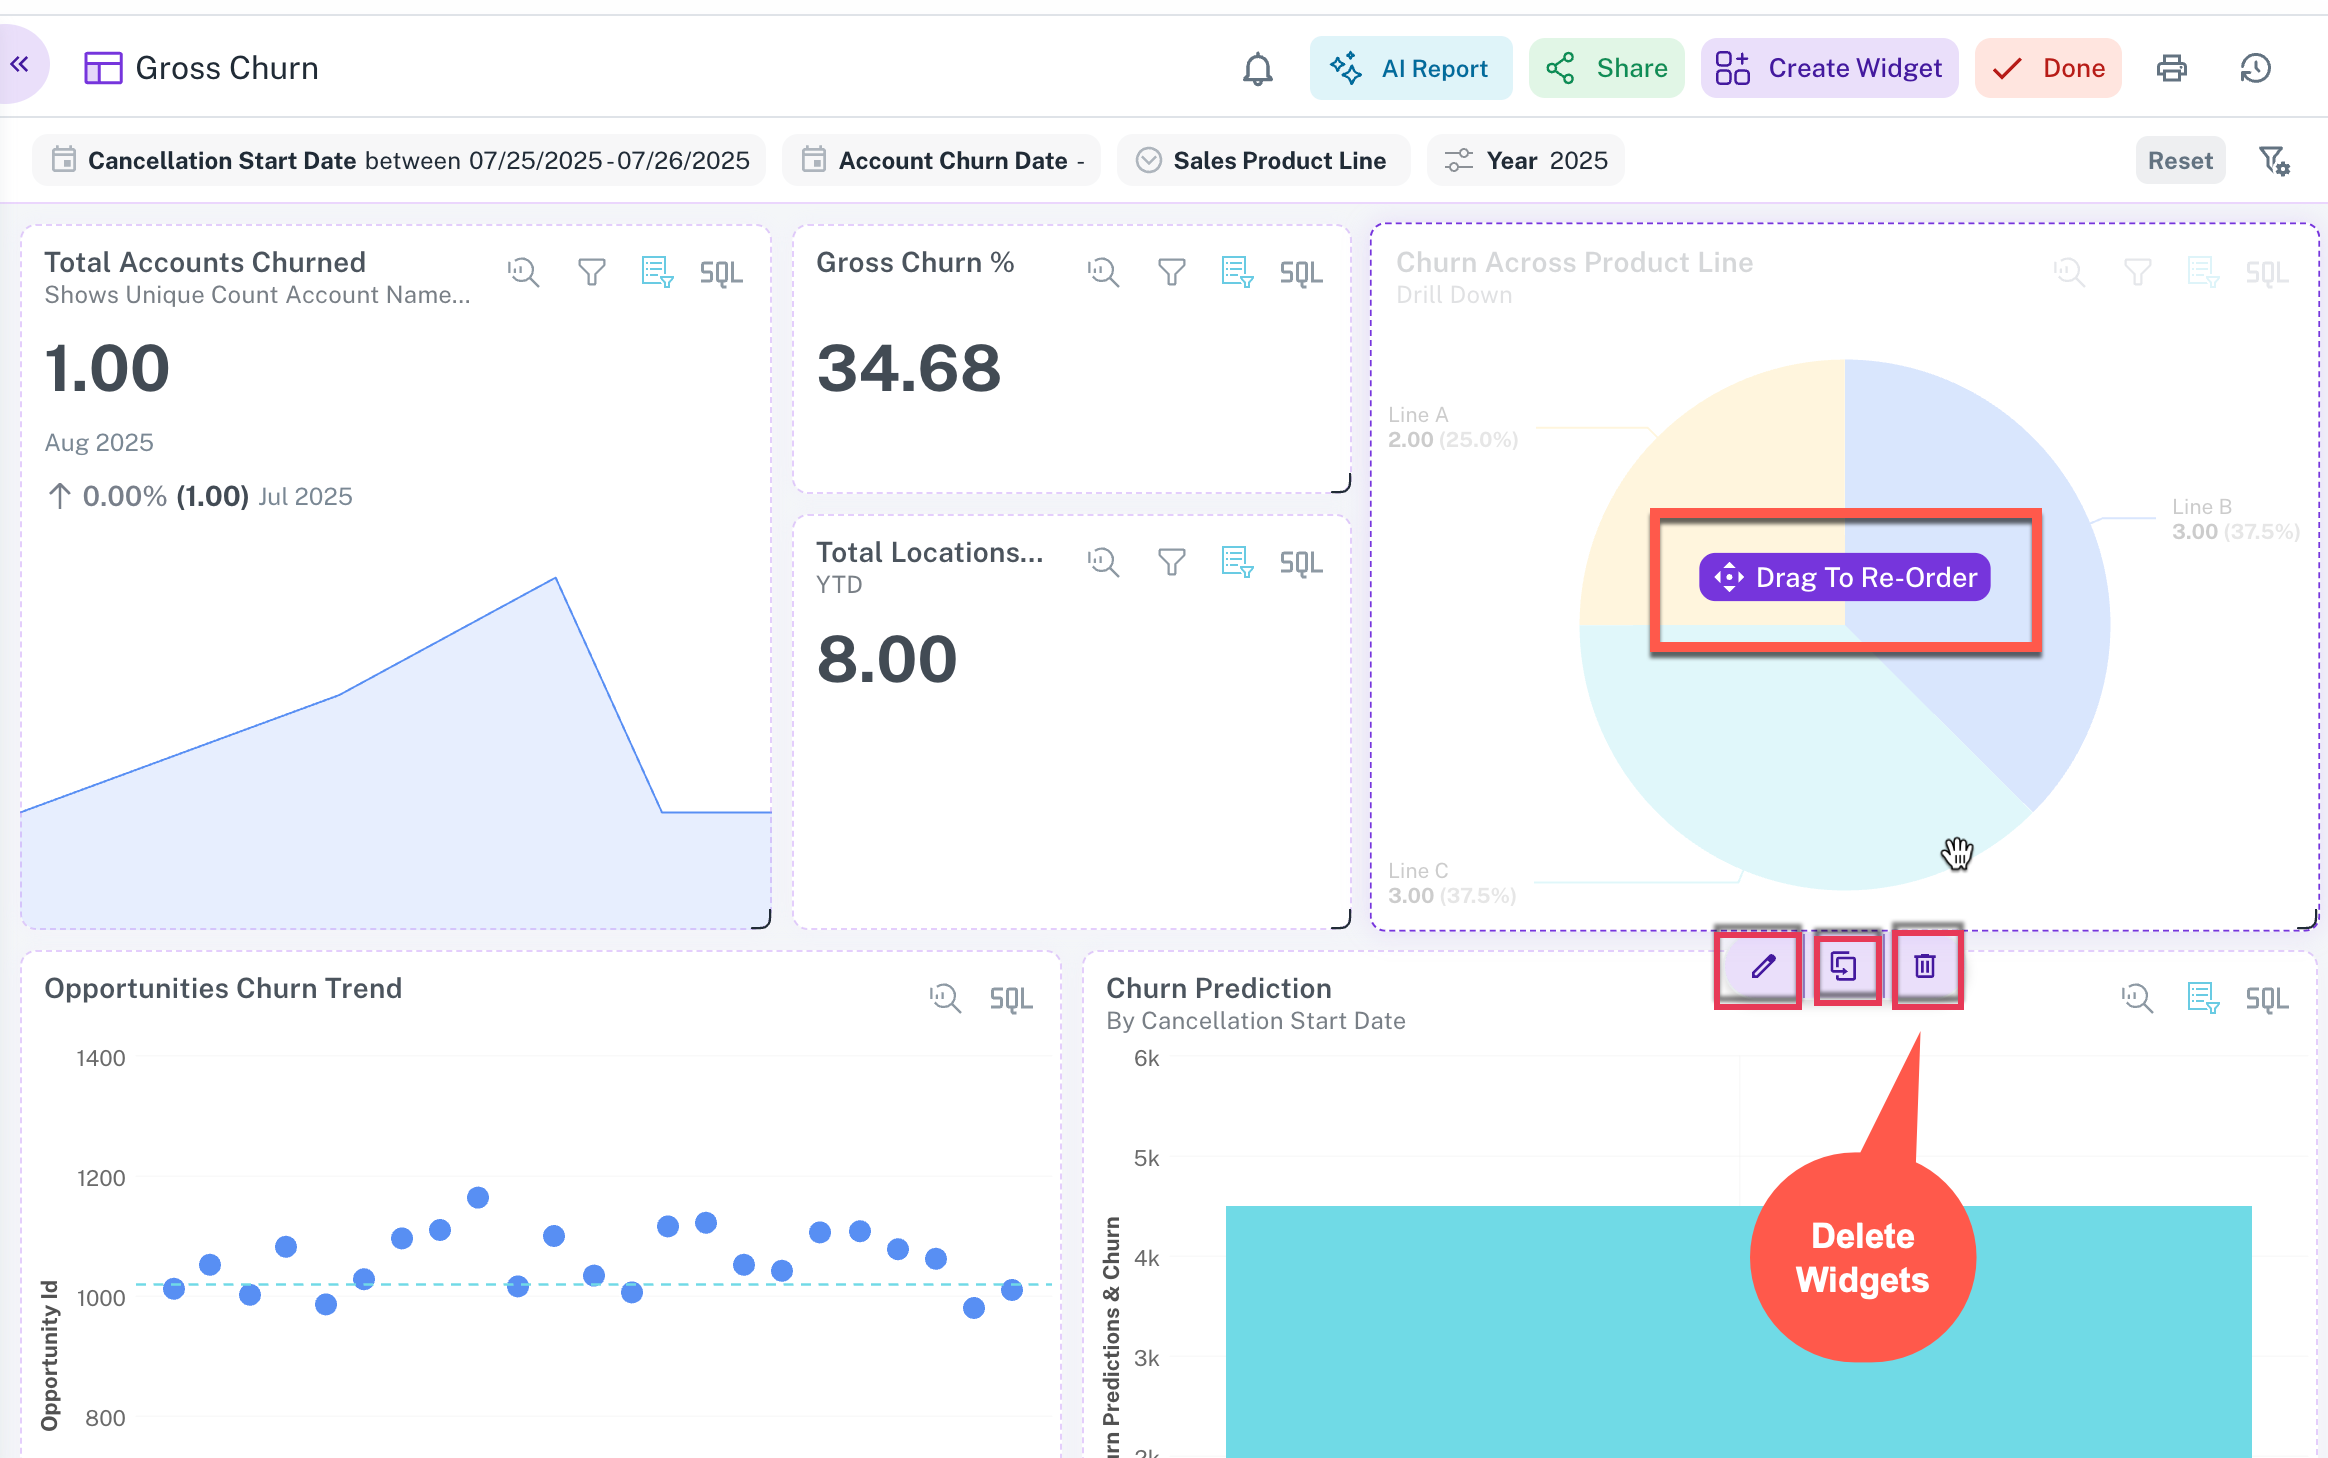
-
Click Delete to confirm.
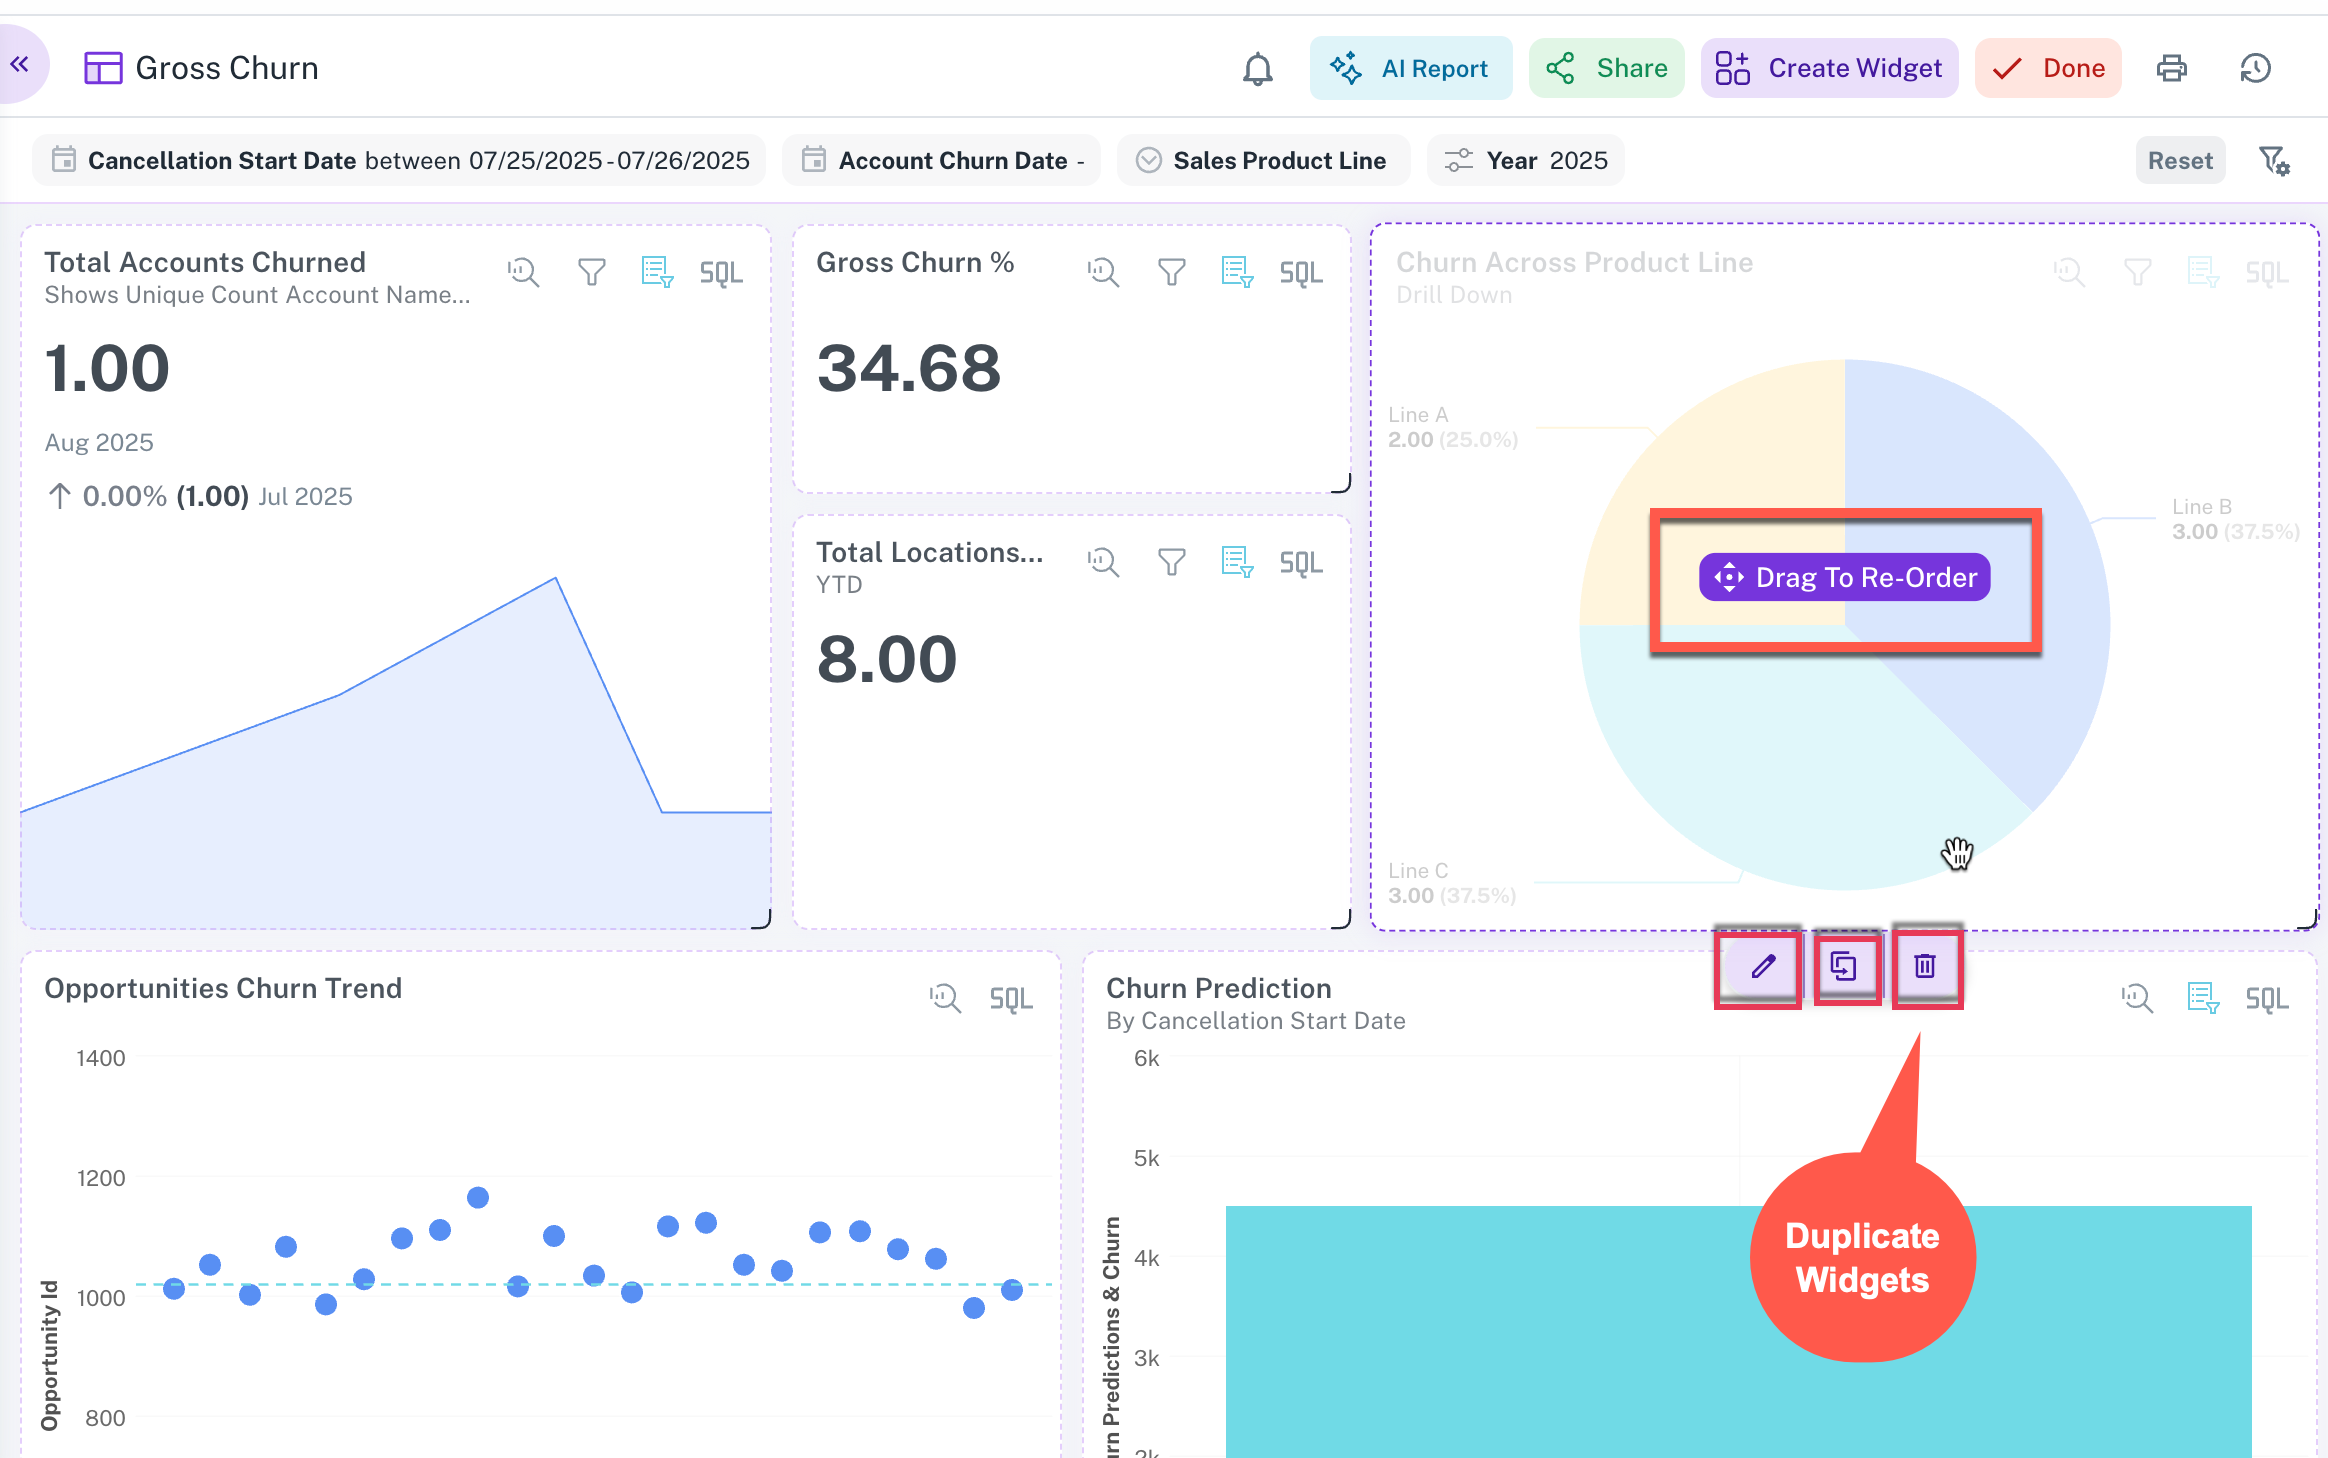
Duplicating widgets on a dashboard
To make minimal changes to a widget you like, you can duplicate it and then edit the copy.
-
From a workspace, on the top, click Dashboard and access a dashboard you want to edit.
-
On the dashboard, from the upper right corner, click the Settings icon and then choose Manage Layouts & Widgets.
-
Hover over any widget that you want to delete and select the duplicate icon under that widget. The copy of the widget is added to the dashboard.
Understanding widget icons on dashboard
The table below provides a description for each item, corresponding to the number shown in the image.
| No. | Item | Description |
|---|---|---|
| 1 | Linked Report | You can add a link or URL to any dashboard page, workbook, or report to provide further insights into the data being displayed. |
| 2 | Help Message | You can add a small help text to each widget to provide a brief description. This can be configured either during the widget creation process in the visualizer or later in edit mode. |
| 3 | Explore Mode | In this mode, a list of auto-populated filters is available on the right side by default. You can add these system-generated filters or manually select others using the Choose filter option at the top right. Moreover, you can also perform other tasks. Refer to Explore Mode |
| 4 | Widget Level Filter | Hovering on this icon will show the list of all the widget level filters that were added on this widget from the visualizer. |
| 5 | Page Level Filter | Hovering on this icon displays the list of page level filters that were configured and applied to this widget from the dashboard page. |
| 6 | Show SQL | To understand the underlying query that powers a widget, you can select Show SQL. This will provide details about the page and widget-level filters applied, as well as any formula columns or parameters currently being used. |
Explore mode
Explore mode on a widget helps you get a more focused view of the widget, on this mode by default on the right hand side there are a list of auto populated / system geenrated filters that the user can add. additionally he can also choose these manually from choose filter option on the top right.
- Right click on the widget and select the Drill Down option to [drill down](/docs/Key capabilities/Drill%20Down/Drill%20Down.mdx) into the data.
- Show Point Data: Right click a specific point and select show point data option from the list. This will show all the indiviual records of the dataset, which led to the final value on the widget.
- Show Raw Data: Right click on the widget and select the Show Raw Data option to view all the records of the workbook powering this widget.
- Show as Table: Using this option, you can view the underlying data in a tabular representation.
- Undo / Redo / Reset: On the top right of the explore mode on the widget, there are following three options:
- Undo: Reverts the last change made and returns the user to the previous screen.
- Redo: Reapplies the last action that was undone, advancing the user to the next step.
- Reset: Restores the widget's visual to its original, default state.
Changes made in Explore Mode are for analysis only and will not be saved to the original widget.
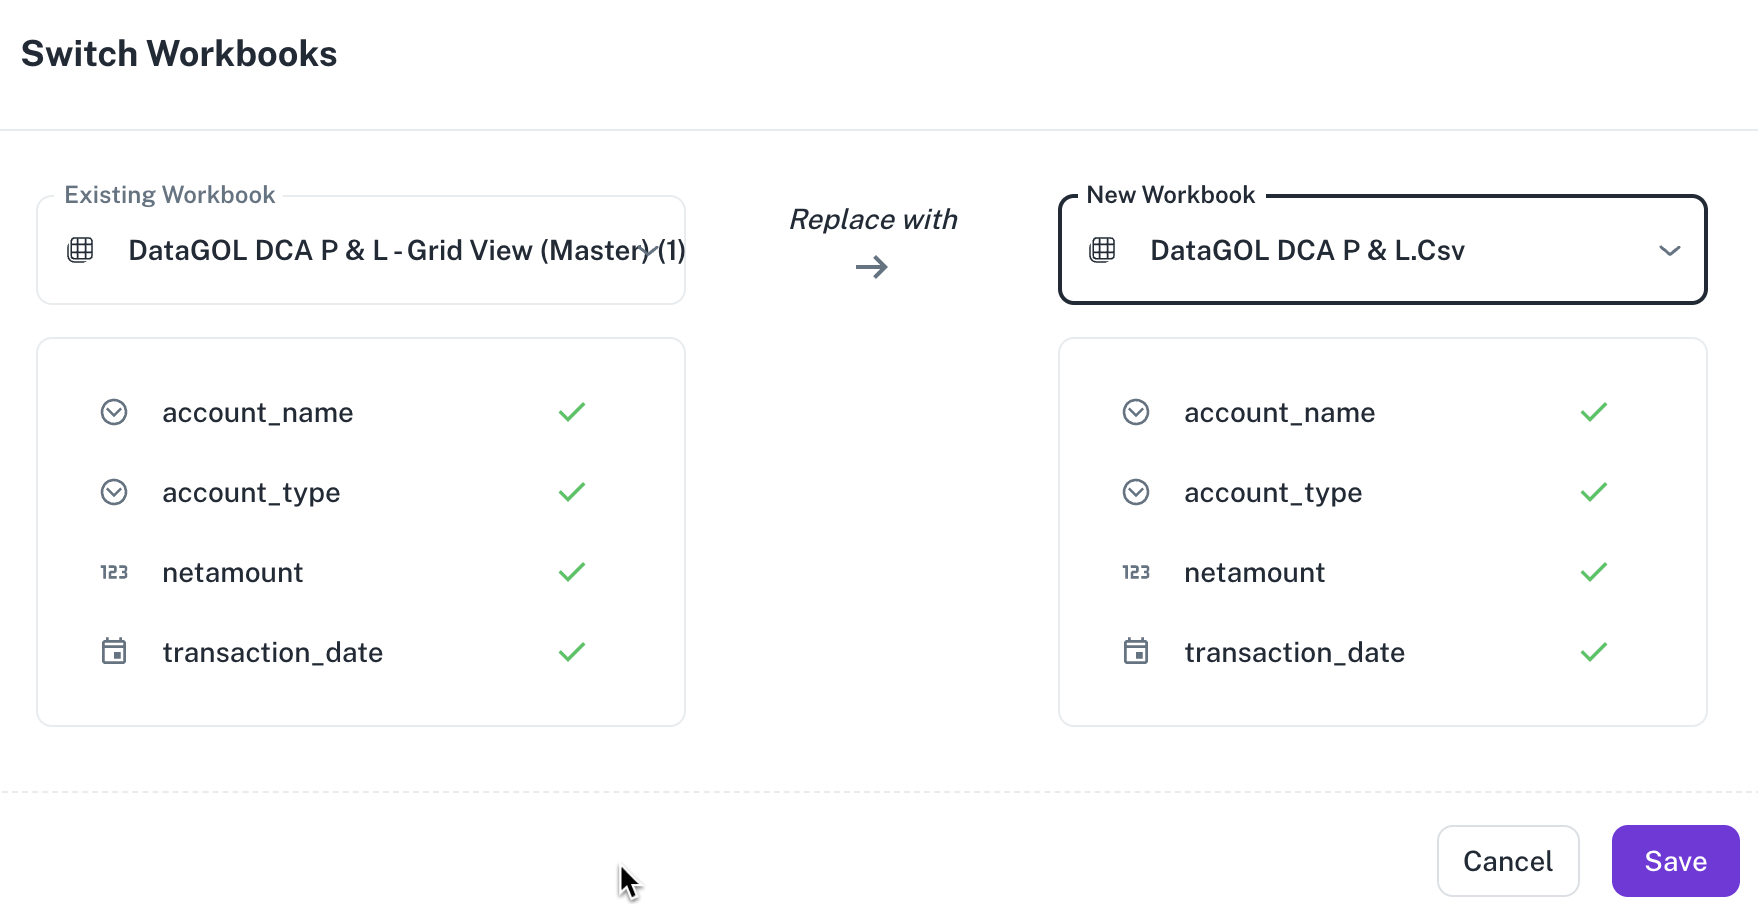
Switching workbooks
You can change the underlying data source of a dashboard from one workbook to another. To replace the workbook currently powering your dashboard, use the Switch Workbook option. Before you proceed, ensure that the new workbook contains all the necessary columns to prevent any data loss or errors on your dashboard.
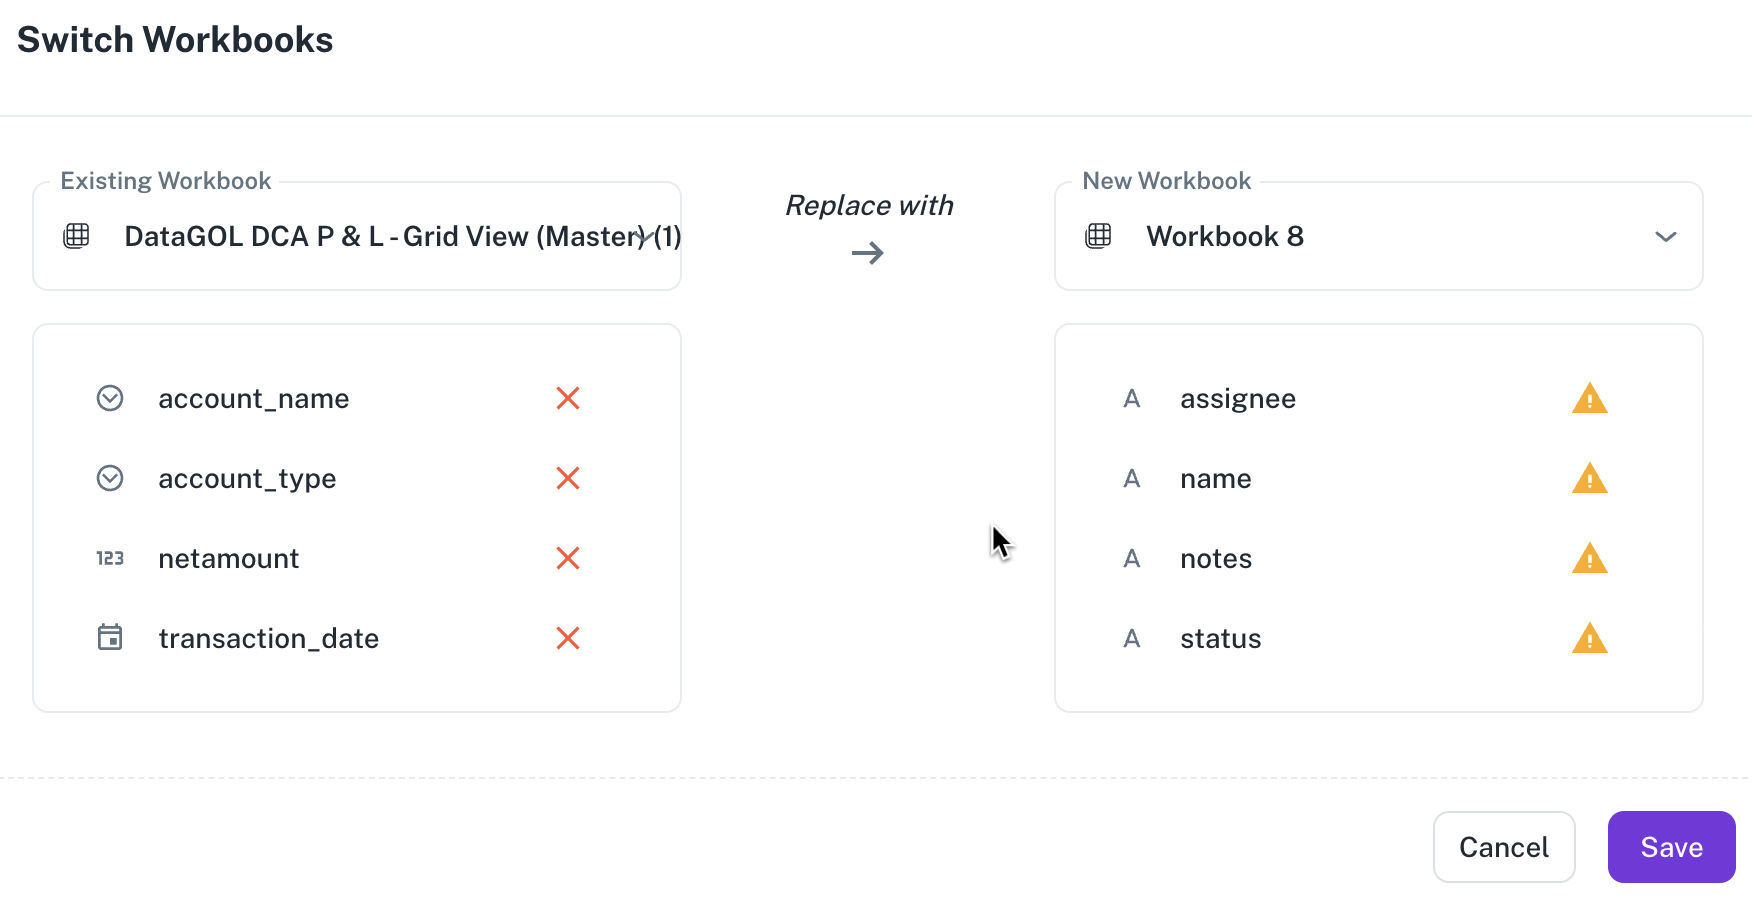
Before switching dashboards to a new workbook, it's crucial to ensure the new workbook is compatible to prevent errors.
This involves verifying that the column names and data types in the new workbook are consistent with the previous one. The application often flags discrepancies like incorrect names or data types with an error indicator, requiring correction before the new workbook is attached.
This proactive check ensures a smoother transition and that the dashboard functions as expected with the updated data source.
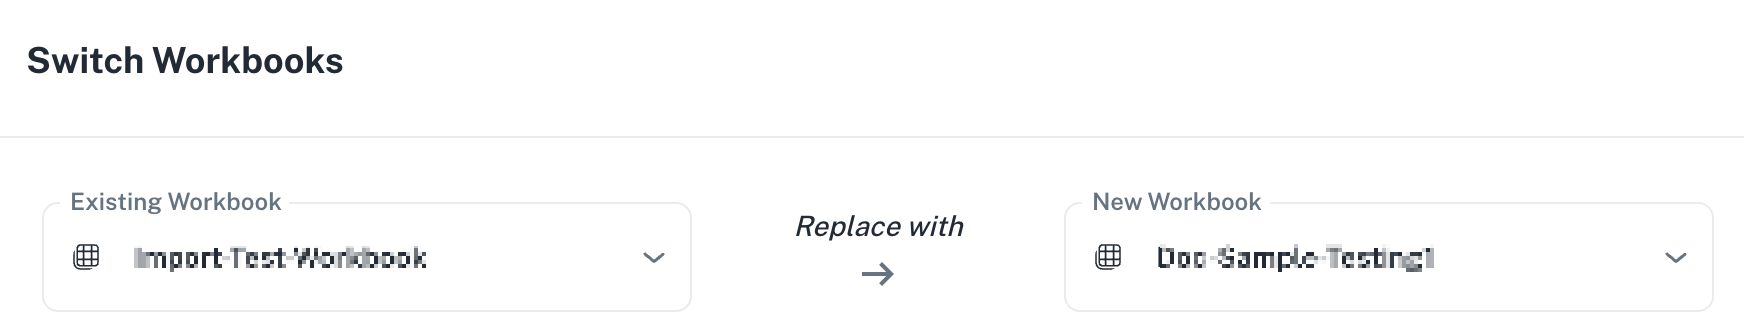
Workbooks with consistent column names
Workbooks with inconsistent column names
Do the following to switch workbooks in a dashboard:
-
From a workspace, access a dashboard.
-
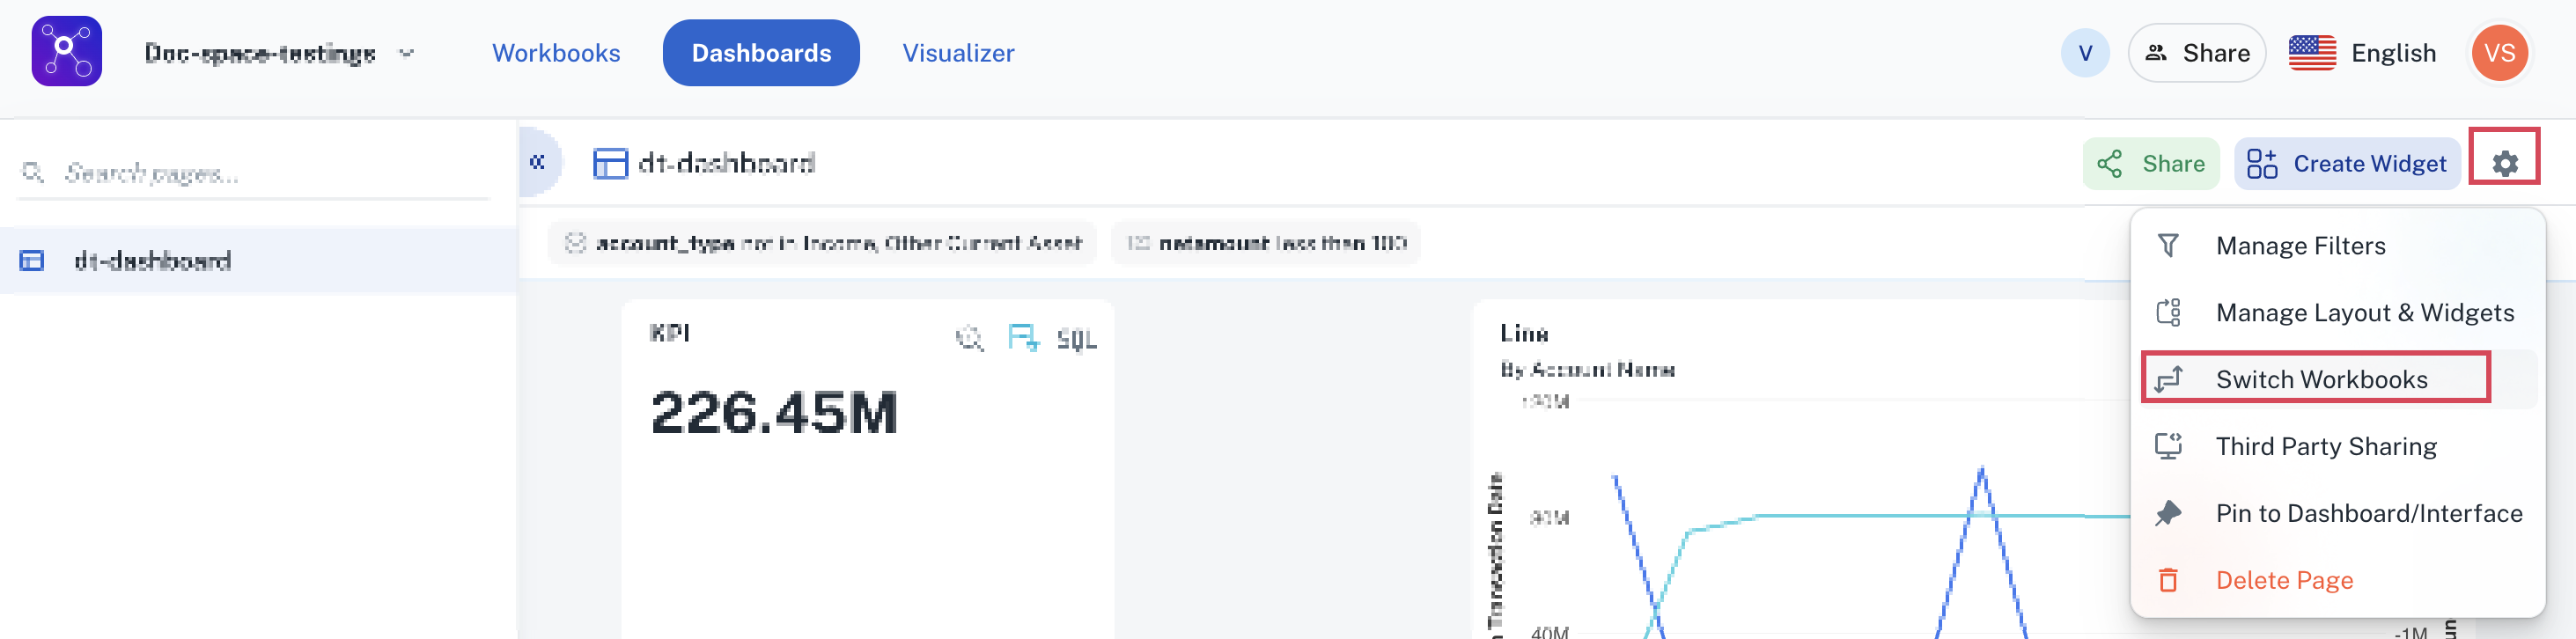
On the dashboard, from the upper right corner, click settings and then choose Switch Workbooks. The Switch Workbooks box is displayed.
-
Select the existing workbook and the workbook you want to replace.
-
Click Save.
Was this helpful?