Widget filters
In the Visualizer, you can add filters at the widget level to refine the data displayed in your visualizations.
Why use widget filters?
- Focus: Display only the data relevant to your analysis.
- Flexibility: Apply different filters to different widgets for customized views.
- Interactivity: Allow users to explore data dynamically by adjusting filter criteria.
TIP
Use a combination of filters to drill down into your data and uncover deeper insights.
Types of widget filters
Widget filters can be applied to three main types of columns:
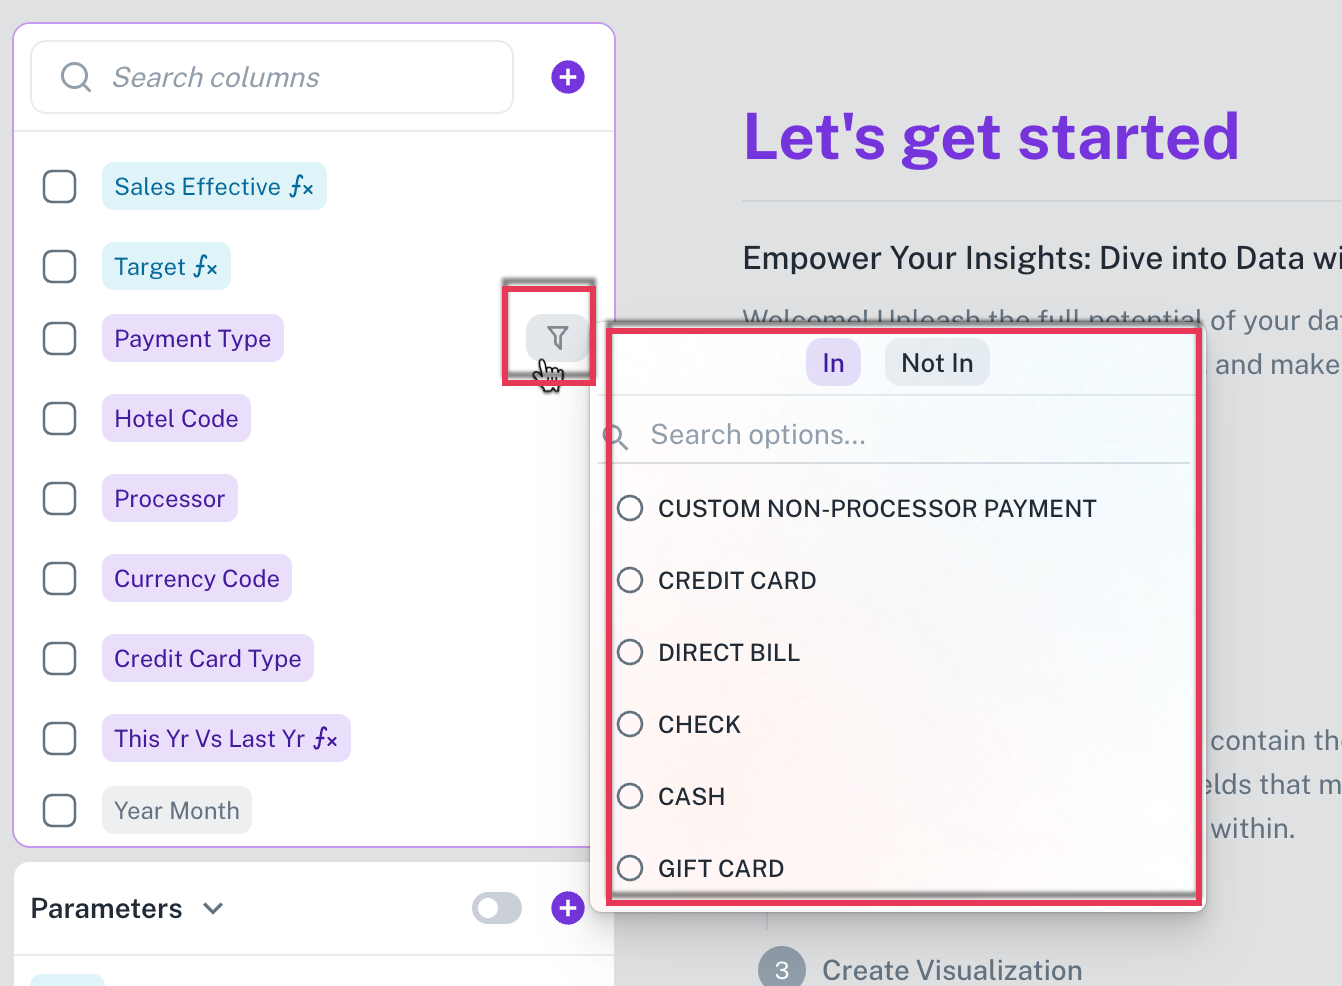
- Dimension (Text Column)
- Description: Categorical or textual columns (e.g., Payment Type, Country).
- How it works:
- The filter appears as a list of available options.
- You can include (
In) or exclude (Not In) specific values.
- Example:
- Filter by "Payment Type" to show only "Credit Card" and "Cash".
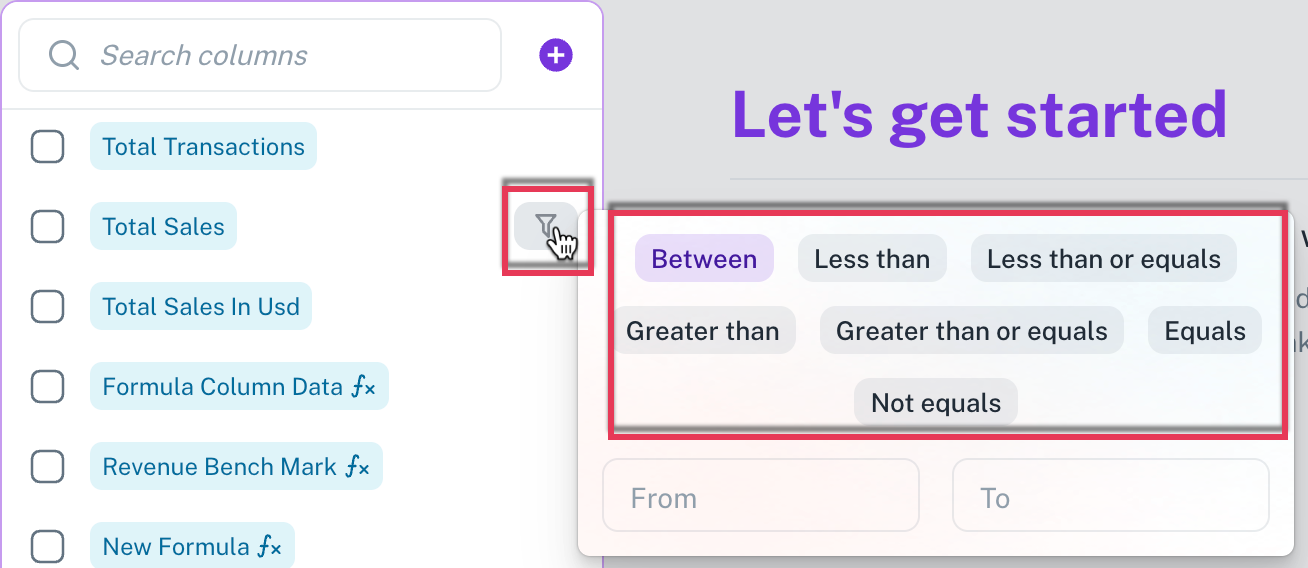
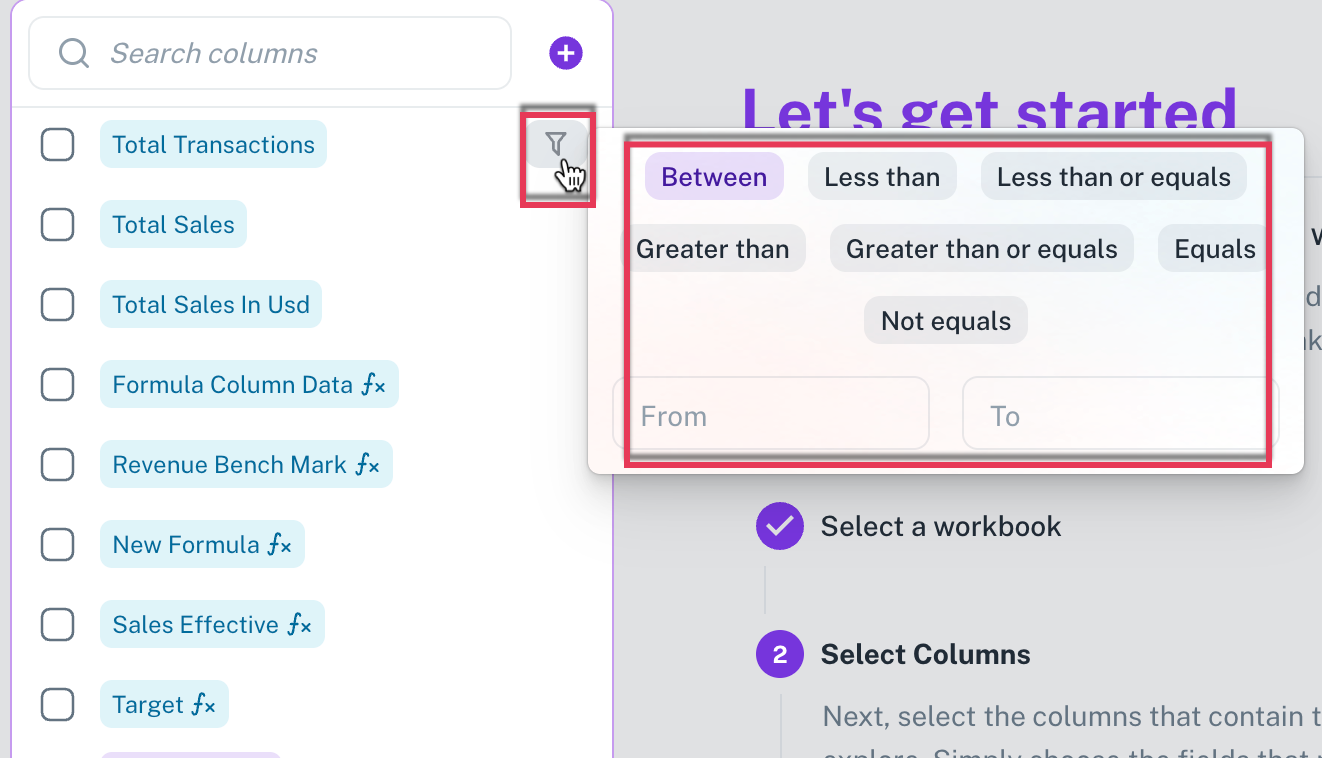
- Metric (Numeric Column)
- Description: Columns containing numerical data (e.g., Sales Amount, Quantity).
- Available filter operations:
- Greater than
- Less than
- Between
- Equal to
- Not equal to
- Example:
- Show only records where "Total Sales" is greater than 1,000.
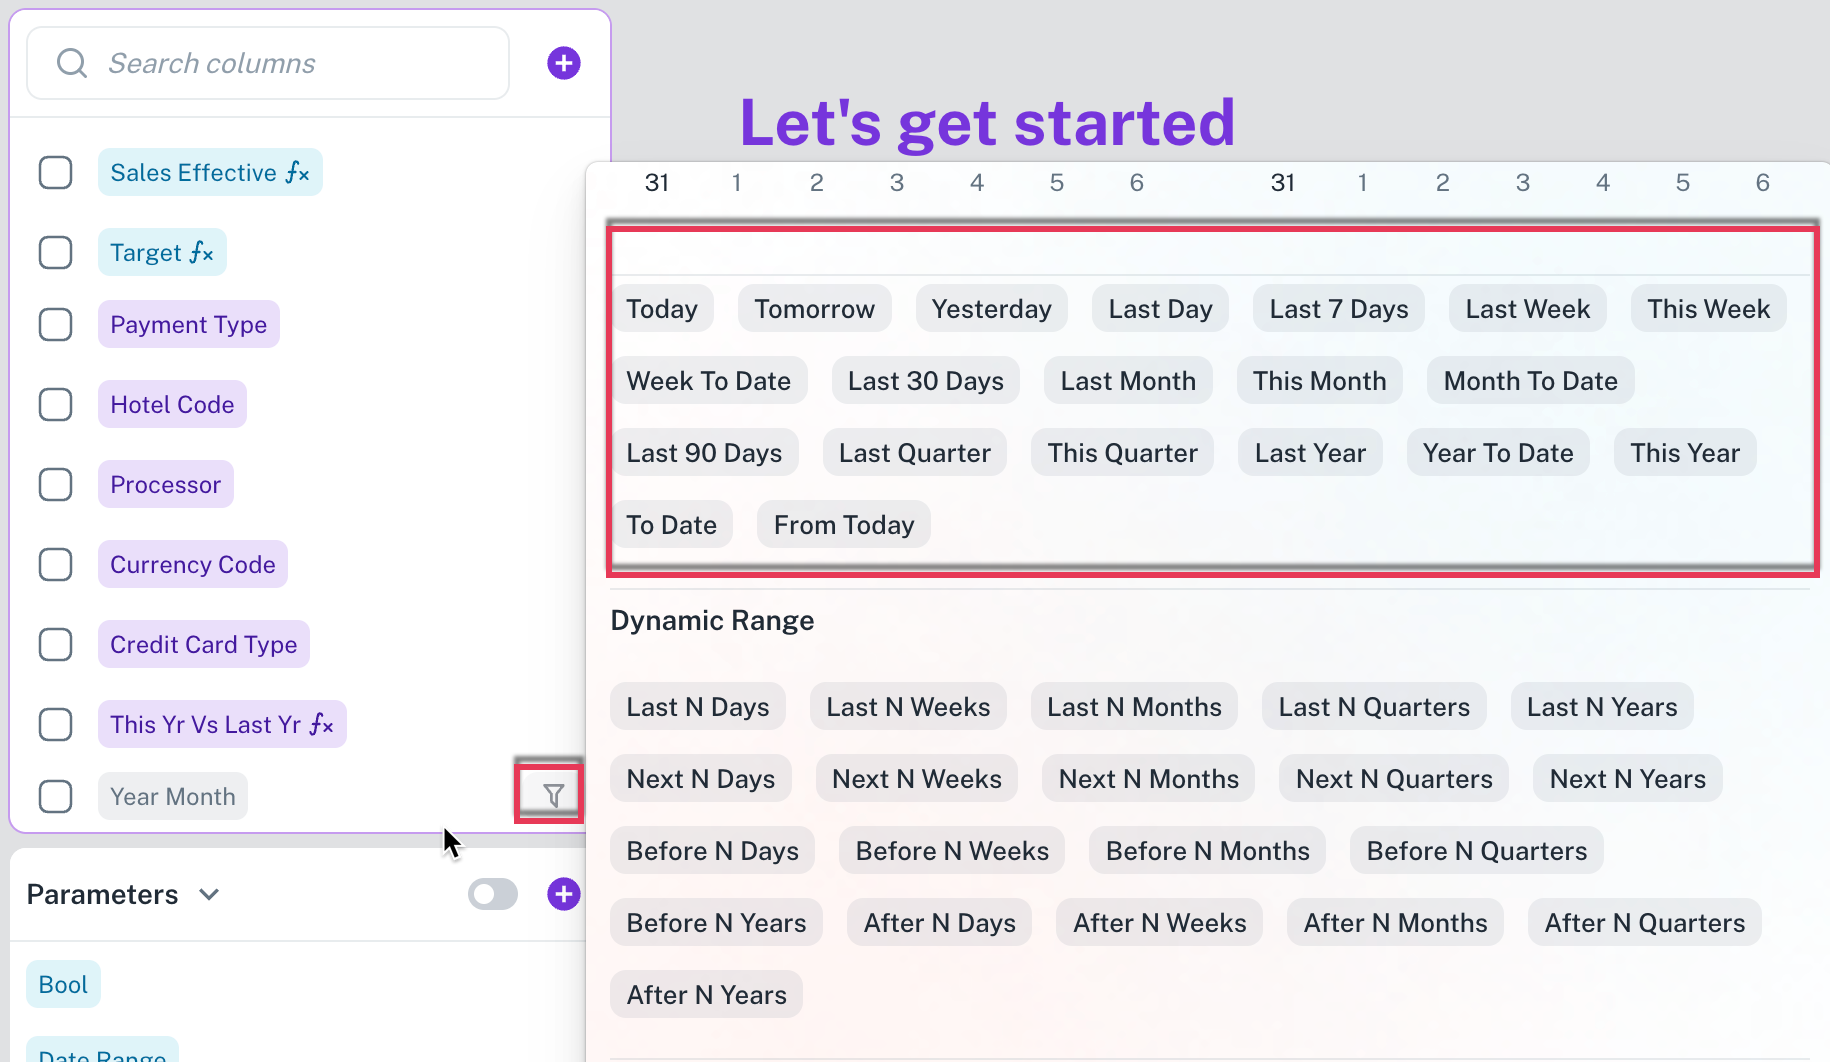
- Date column
- Description: Columns containing date or time values.
- Available filter options:
- Custom date range: Manually select start and end dates on the calendar.
- Rolling date ranges: Predefined options like Today, This Week, Last Month, Year to Date, etc.
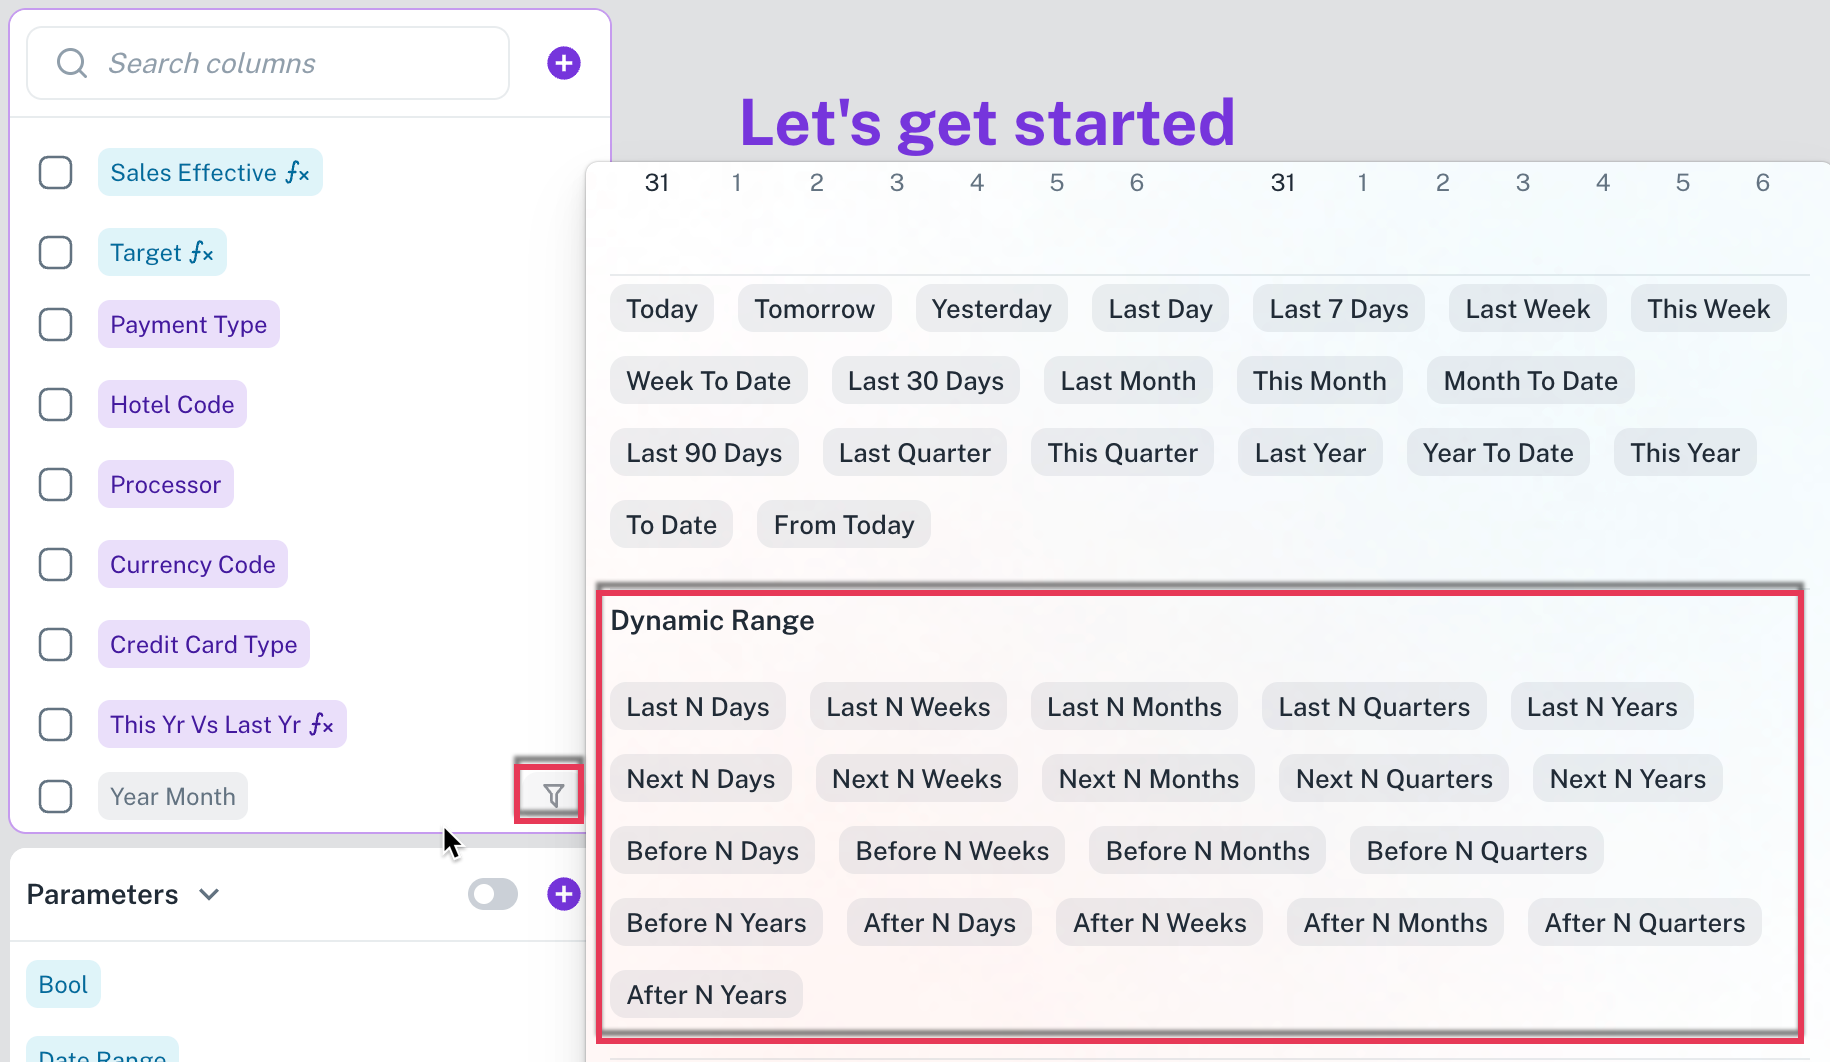
- Dynamic date ranges: Last N days/weeks/months/quarters/years, Next N days/weeks/months, etc.
- Time buckets: Filter by Month of Year, Day of Week, Quarter of Year, Week of Year, etc.
- Example:
- Show data for "Last 30 Days" or "This Quarter".
 |  |
How to add a widget filter?
-
On the left-hand panel, hover over any column. A filter icon will appear beside the column name.
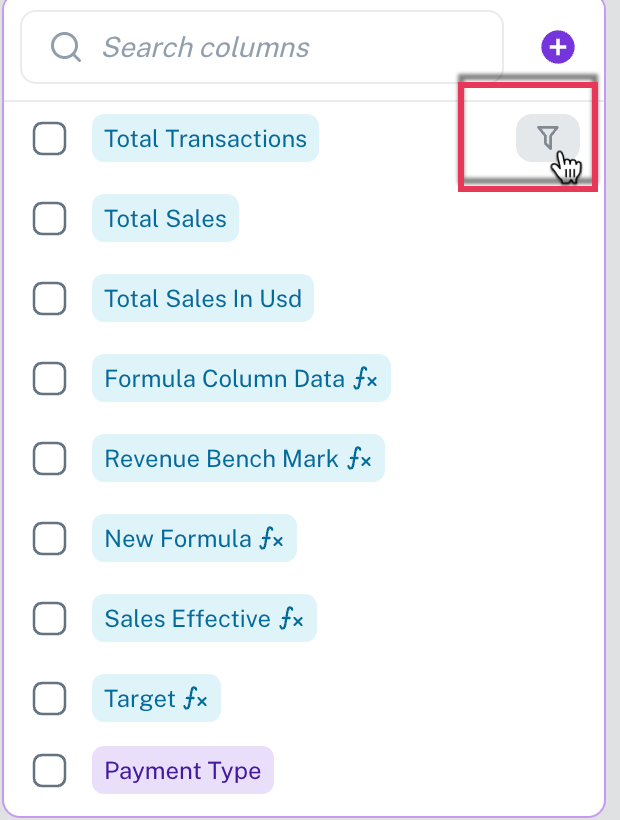
-
Click the filter icon to open filter options for that column.
-
Configure the filter as needed; the filter will apply only to the current widget.
Was this helpful?