Viewing the orchestration run details
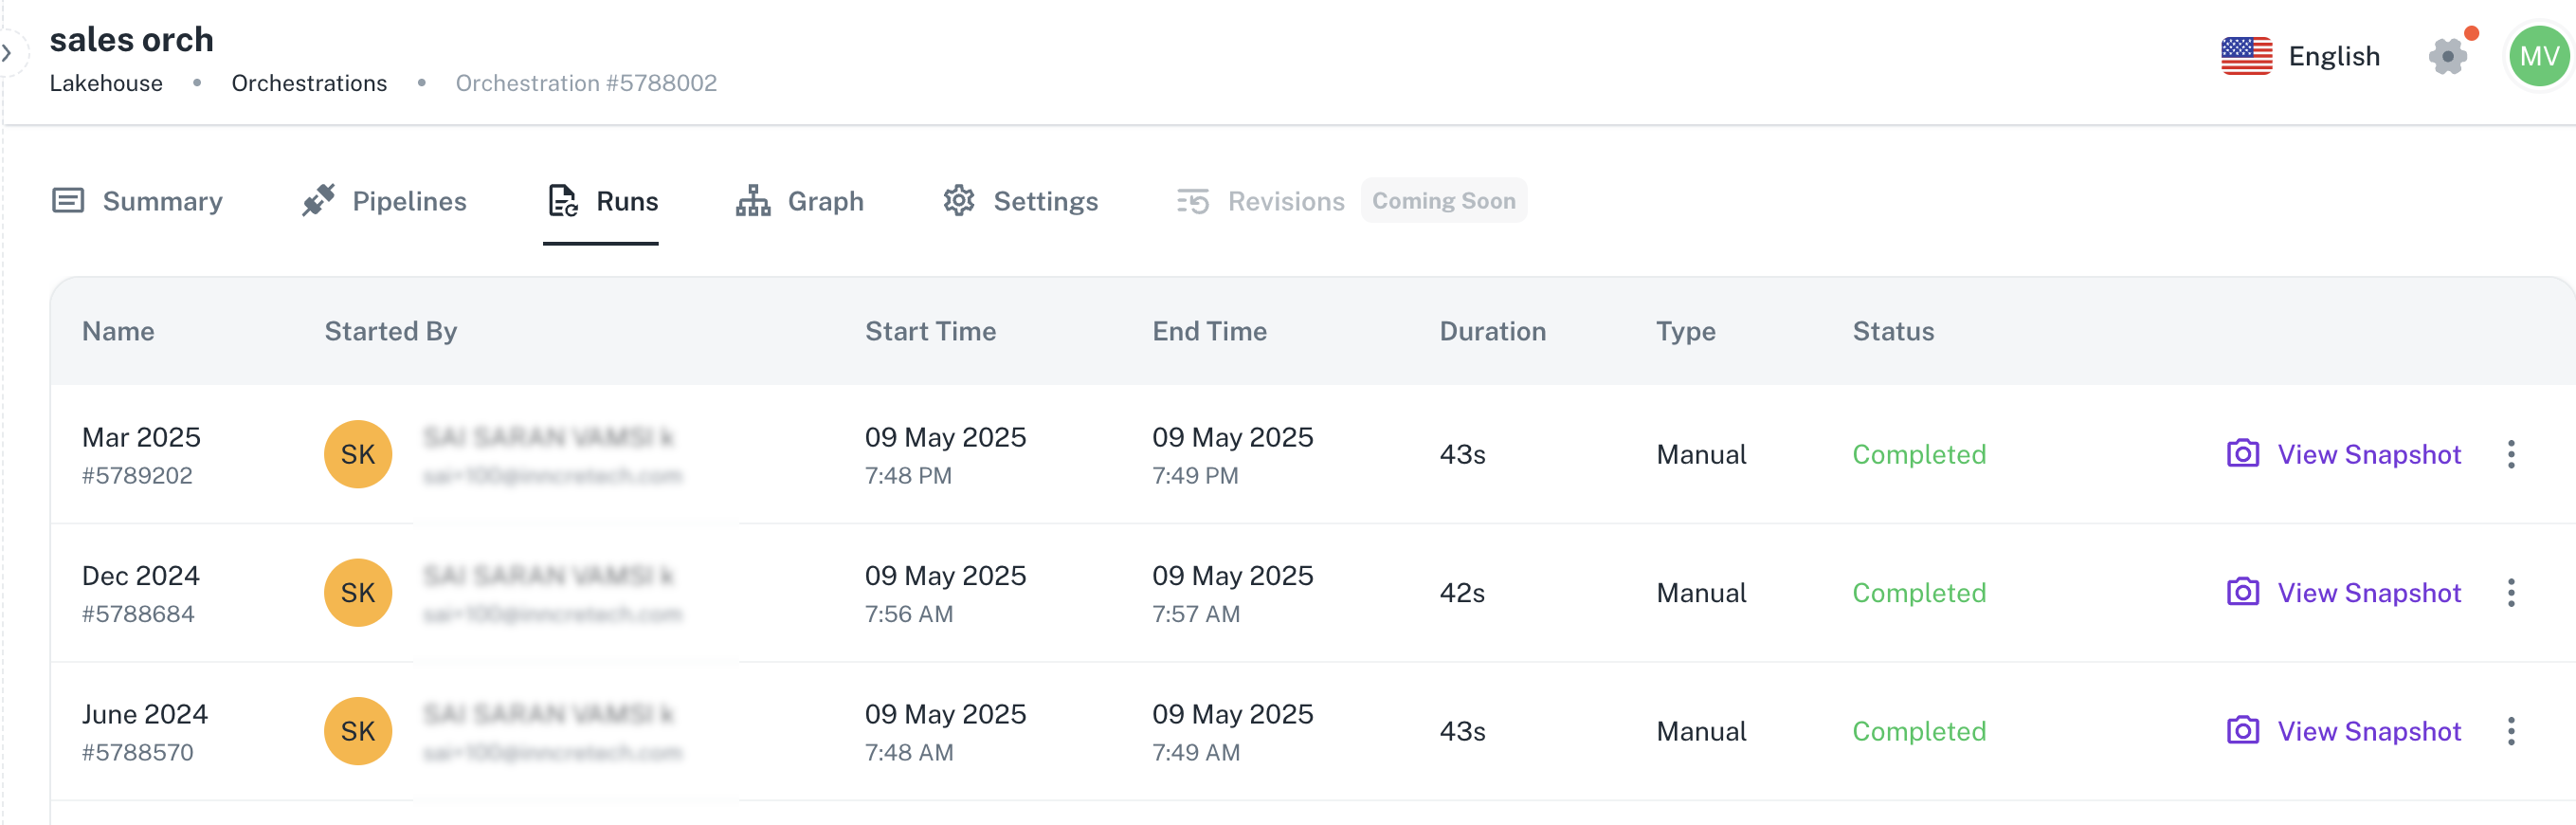
The Runs tab provides a comprehensive view of each orchestration execution. Here, you can readily see details such as the run's name, the user who initiated it, the start and end times, the total duration, and the current status (e.g., completed, failed). To investigate data lineage, click the more options icon. Additionally, clicking the View Snapshot link offers a detailed, point-in-time overview of that specific run.
-
On the DataGOL Home page, from the left navigation panel, click Lakehouse > Orchestration.
-
In the Orchestrations page, click the link of an orchestration.
-
Click the Runs tab. You can view the following details:
-
Name: Name of the orchestration run.
-
Started By: Details of the user (name and email) who initiated the orchestration run.
-
Start Time: When the orchestration run was executed.
-
End Time: When the orchestration run ended.
-
Duration: The duration of the orchestration run.
-
Type: Specifies if this is a manual, cron, or scheduled orchestration run.
-
Status: Specifies the current status of the orchestration run. For example: failed, completed etc.
-
View Snapshot: Click the link to view a quick snapshot of the details of the orchestration run. The snapshots of an orchestration run details the executed pipelines and their statuses at a given time, as your orchestration may not remain constant across different runs.
-
More options icon: Scroll right and click the more options icons to view the data lineage.
-
Was this helpful?