Viewing workbook lineage
The workbook Lineage view offers a visual representation of how data flows from raw sources through pipelines into workbooks, helping users trace, audit, and understand column-level transformations.
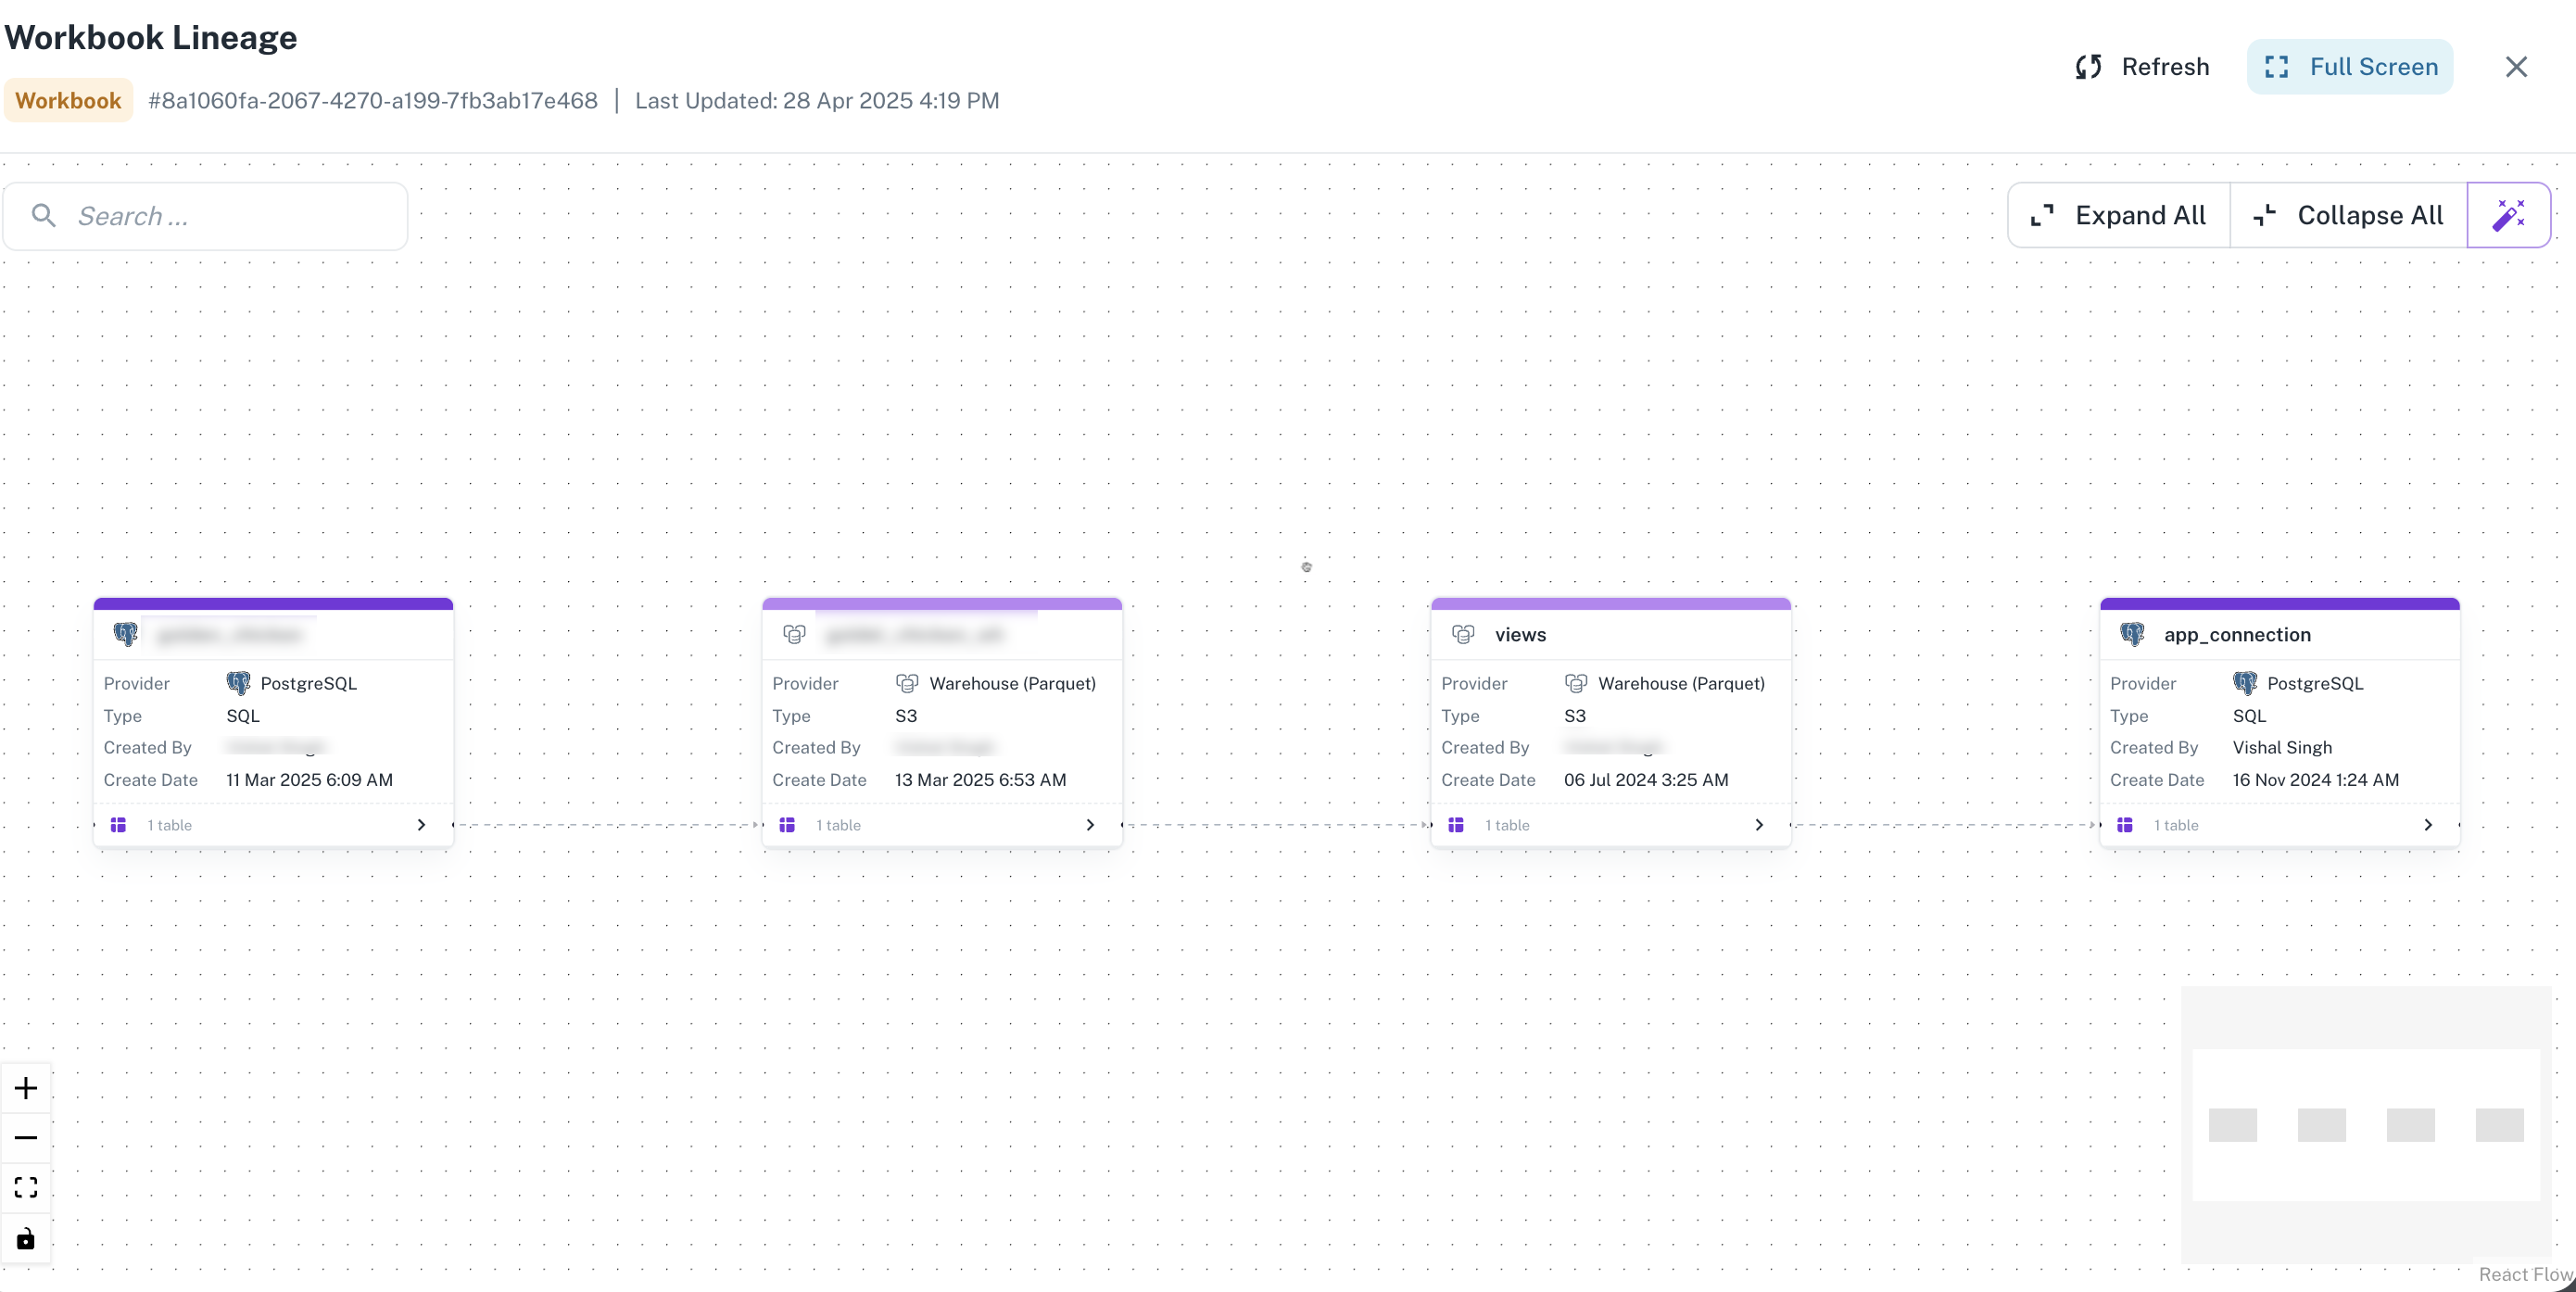
Structure
- Nodes represent data sources (e.g., MySQL, S3, PostgreSQL) or workbooks.
- Edges represent pipelines that move or transform data between nodes.
Interactions
- Click a Node to view metadata about the data source or workbook, including creation details and tables/columns.
- Click an Edge to view pipeline information—source/destination, replication method, job status, and more.
- Click a Column to trace the flow of that specific column from its raw source. The lineage graph highlights the related edge path, making it easy to follow column-level dependencies.
Navigation Features
- Search: Find a specific column, table, or node quickly.
- Expand/Collapse: Simplify the graph view by collapsing unrelated branches or expanding full data flows.
-
On the Home page, from the left navigation panel, click Workspace, and from the list of workspaces, open the workspace where the workbook that you want to edit is located.
-
Click the Workbook tab and select the required workbook.
-
Click the Settings button on the top and select View Lineage. The details of the workbook lineage are presented.
-
You can click on any of the info boxes and further data source details are displayed. Click Views for more in-depth information.
Was this helpful?