Cohort Analysis
Cohort Analysis
Cohort Analysis groups users by their signup or first-activity month and tracks retention over subsequent periods as a heatmap, making it easy to spot drop-off patterns at a glance.
When to use: Tracking user retention over time, identifying drop-off periods, or analyzing behavioral patterns across user groups.
How to create:
- Open the Visualizer editor and select your date field and user identifier columns.
- Choose Cohort from the Visualization panel.
- Configure the three key fields in the Configuration panel:
| Field | Description |
|---|---|
| Cohort Date | The date column that defines when a user first appeared (cohort assignment). |
| Activity Date | The date column that records subsequent user activity. |
| Metric | The value to display in each cell (e.g., Retention Percentage). |
Sample formulas:
Use these calculated columns in DataGOL's formula editor to prepare your data.
Cohort Month — assigns each user to their earliest month of activity:
LOD_FIXED(
    MIN(DATE_TRUNC('month', "Date")),
    "User_ID"
)
Activity Month — truncates each row's date to the month level:
DATE_TRUNC('month', "Date")
Retention Percentage — calculates the percentage of cohort users still active in a given month:
100.0 * COUNT(DISTINCT "User_ID") / LOD_FIXED(
    COUNT(DISTINCT "User_ID"),
    "cohort_month"
)
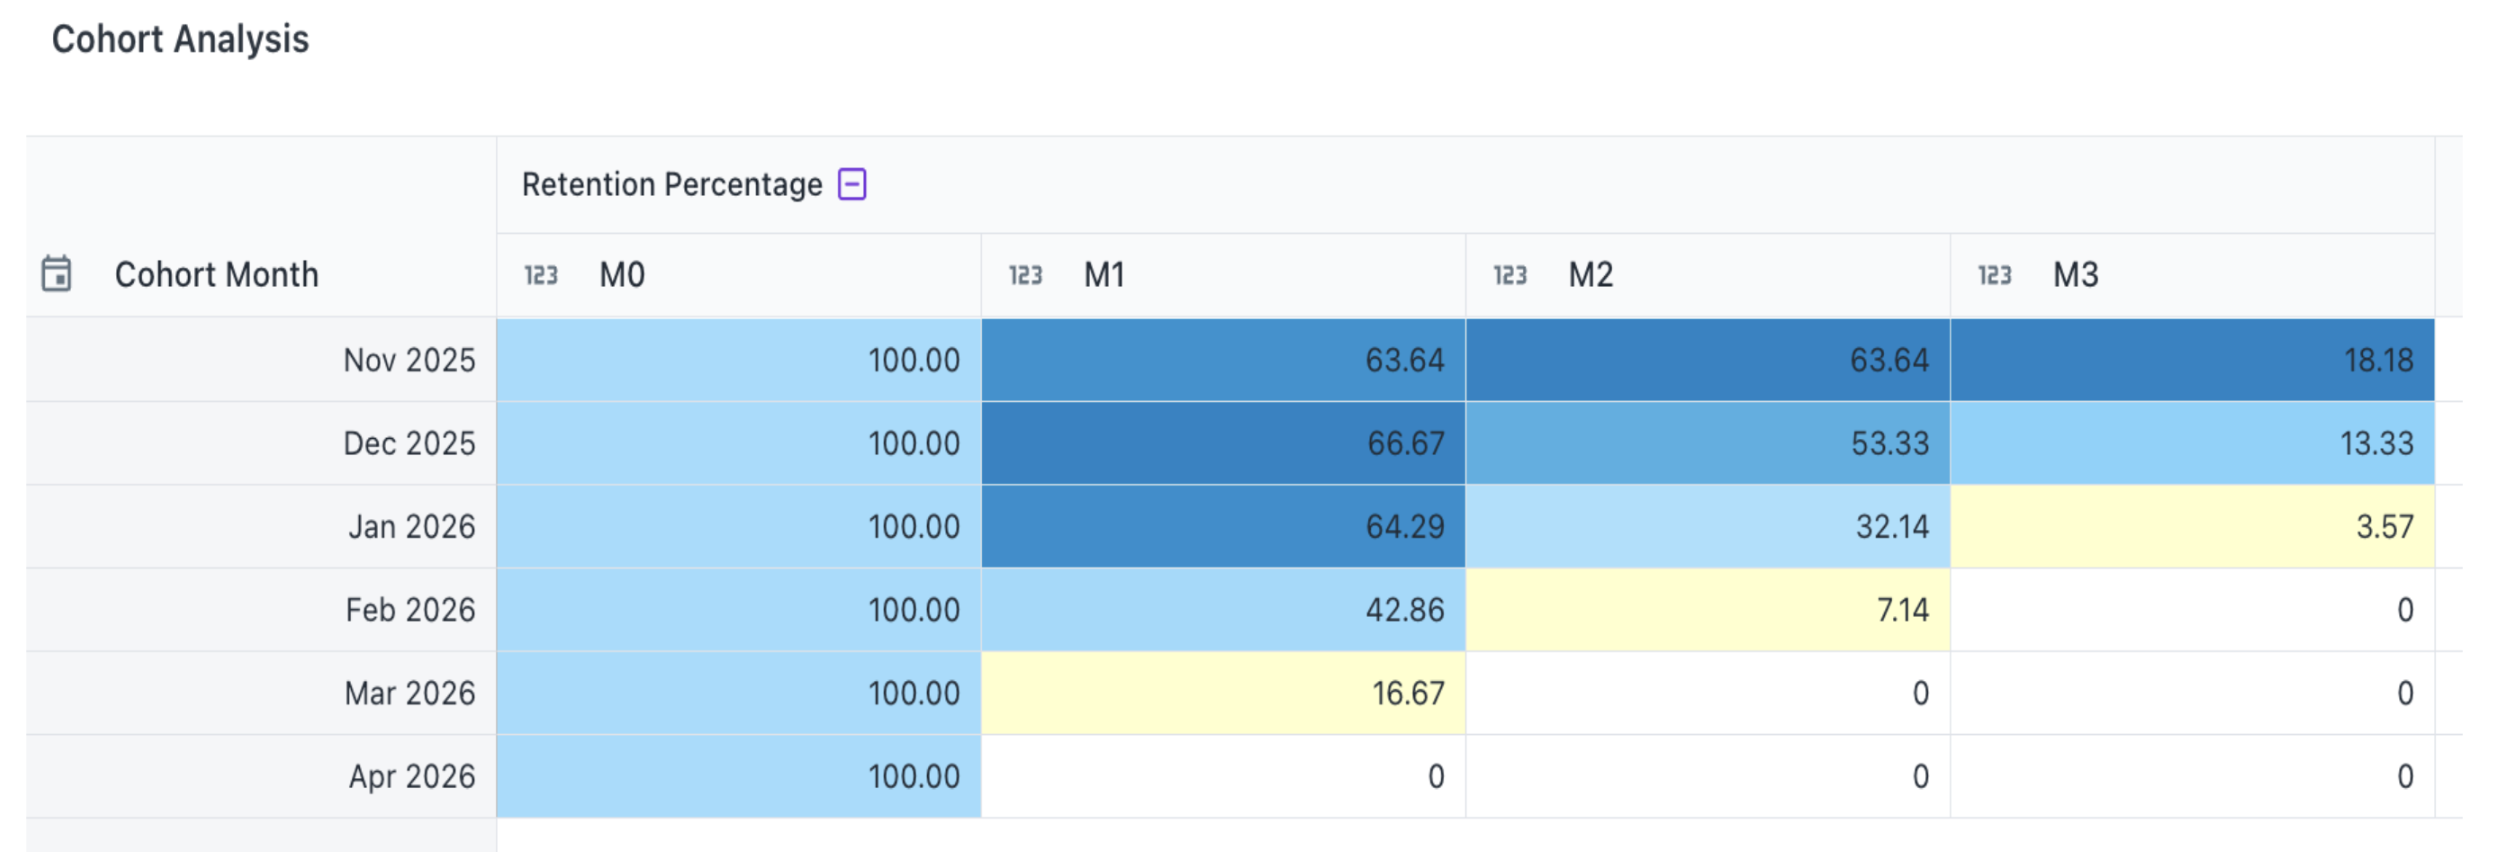
Reading the cohort table:
Rows represent cohorts (users who first appeared in a given month). Columns M0 through Mn represent months since cohort entry — M0 is always 100% (the entry month), and subsequent columns show the percentage of users who returned. Color intensity reflects retention, making drop-off patterns immediately visible.
Was this helpful?