v1.0.262
Date released: April 23, 2026
New Features and Enhancements
BI
-
Page-Level Filter: Exclude Weekends A new toggle in the date picker lets you exclude Saturday and Sunday from all dashboard visualizations in one click. Perfect for business metrics where weekend data creates noise in otherwise weekday-driven trends.
-
Embedded Dashboards: DataGOL dashboards can now be embedded into external apps and websites via IFrame, JavaScript Widget, Data Attributes, or React component. Users can interact with analytics directly inside your product without ever logging into DataGOL.
-
Theming for Embedded Dashboards: A new Theme Editor lets you customize tile titles, header backgrounds, font sizes, and colors on embedded dashboards. Match your product's branding seamlessly — accessible from dashboard settings under Theme Editor.
-
Dynamic Parameters (SQL-Driven Dropdowns): Parameter dropdowns can now be auto-populated from a SQL query, keeping filter options always in sync with your data. Users get live-updating dropdowns on dashboards, and values can be referenced in formula columns using
{{param}}syntax. -
Reordering Parameters on Dashboards: Parameters can now be drag-and-drop reordered and toggled visible/hidden directly from Dashboard Page Settings. Gives teams full control over the filter experience presented to end users.
-
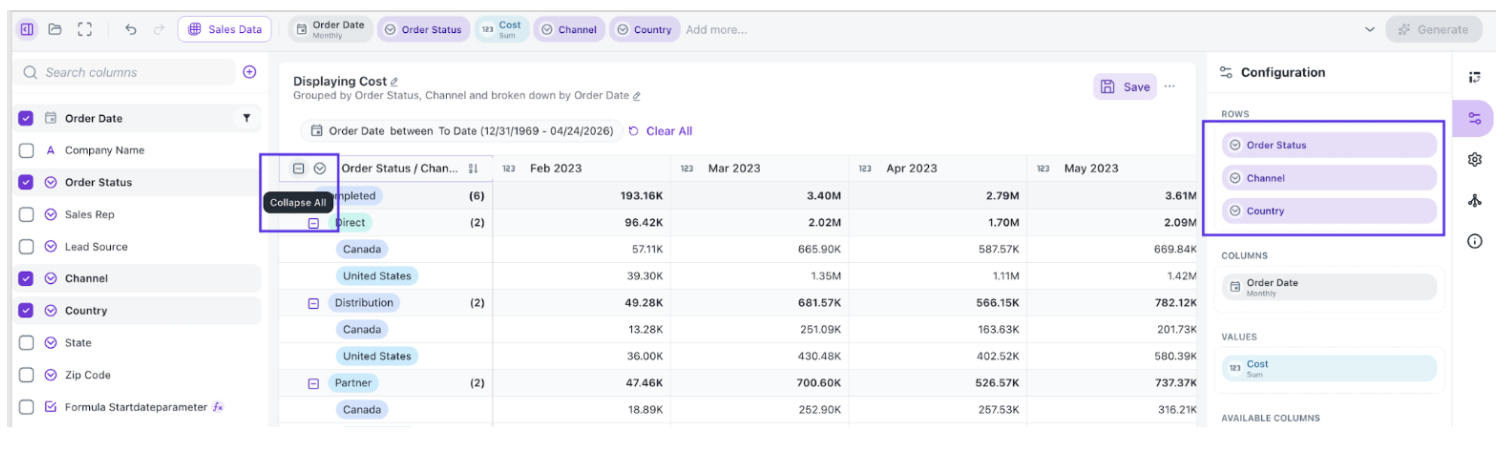
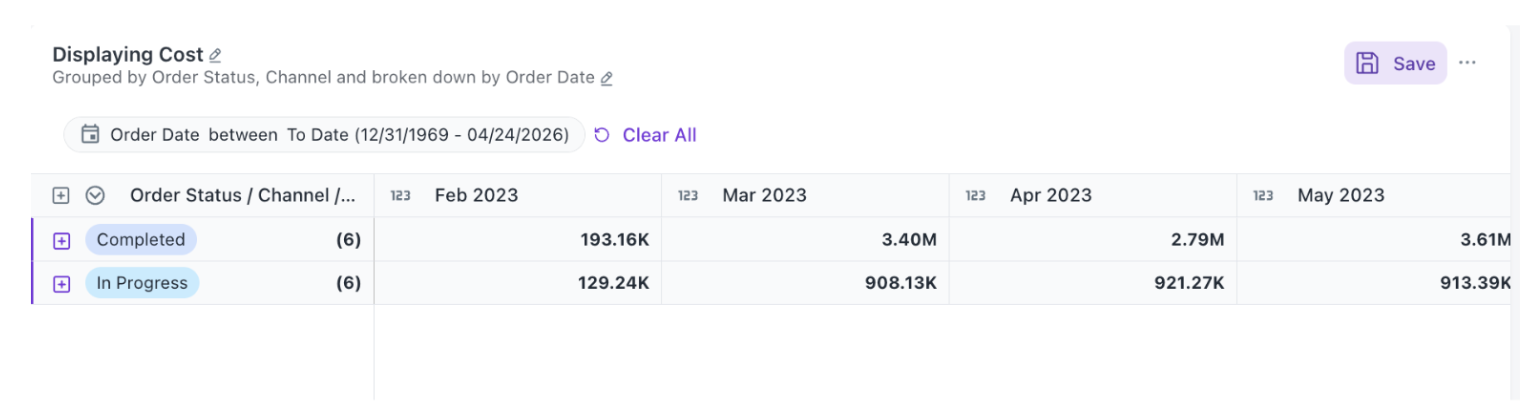
Collapse All on Pivot Table Rows: Pivot Tables now include a Collapse All button that folds every row group to the top level instantly. Ideal for high-level summaries — individual groups can still be expanded with the + icon.
Bug Fixes
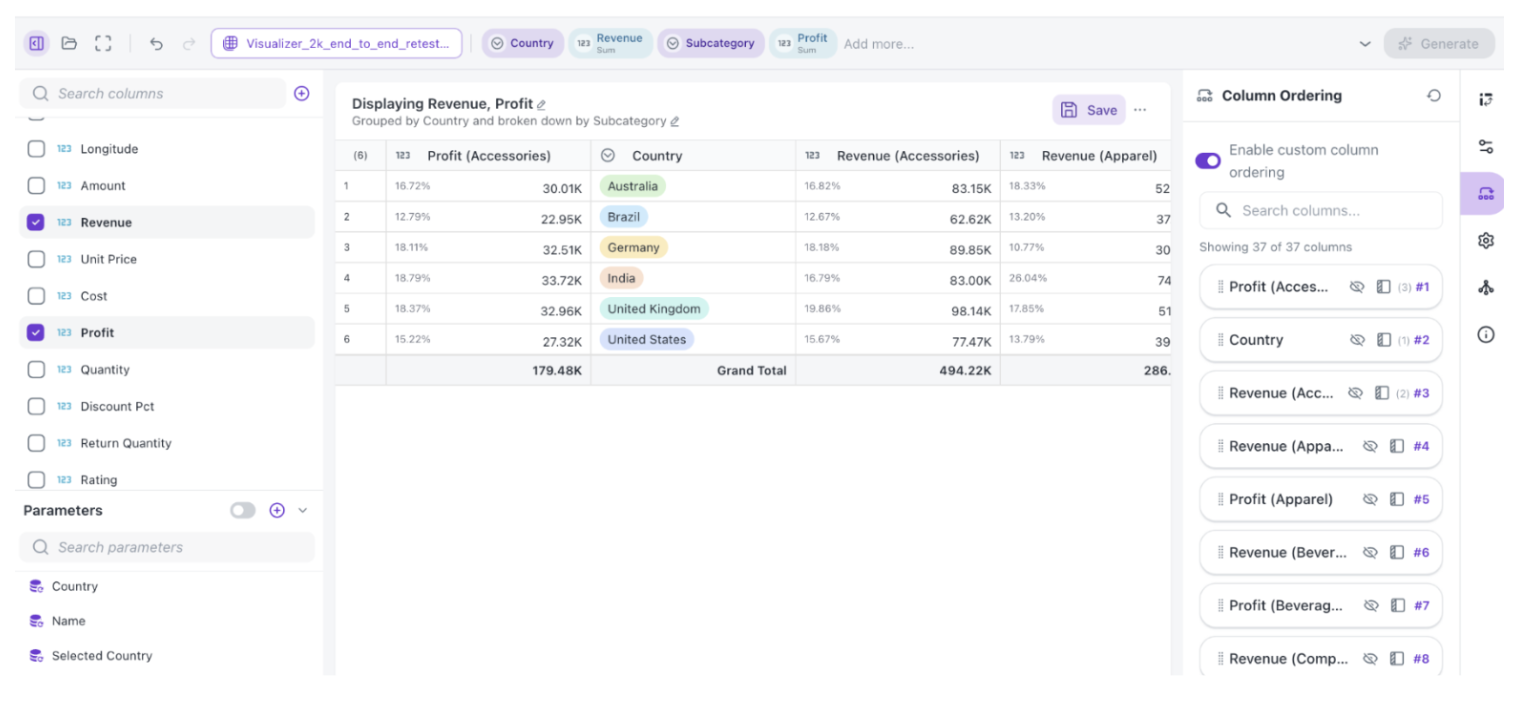
- Pivot Table Percentage Values Follow Column Reordering: Percentage values in Pivot Tables previously stayed in their original position when columns were reordered. This is now fixed — percentage values correctly follow their associated columns on reorder.
Was this helpful?