v1.0.184
Date released: October 9, 2025
New features and enhancements
The following new features are included in this release:
Backend
Added backend API support for a new showByDefault property on all parameters. This boolean flag determines whether a parameter should be visible or hidden by default in the user interface.
-
How it works: When set to false, the parameter will be hidden initially and must be explicitly enabled by the user to appear. When set to true, it remains visible by default, matching existing behavior.
-
Key benefit: This allows administrators to set up advanced reports with many possible filters but only show the most critical parameters initially, significantly improving the default experience and reducing clutter.
BI
-
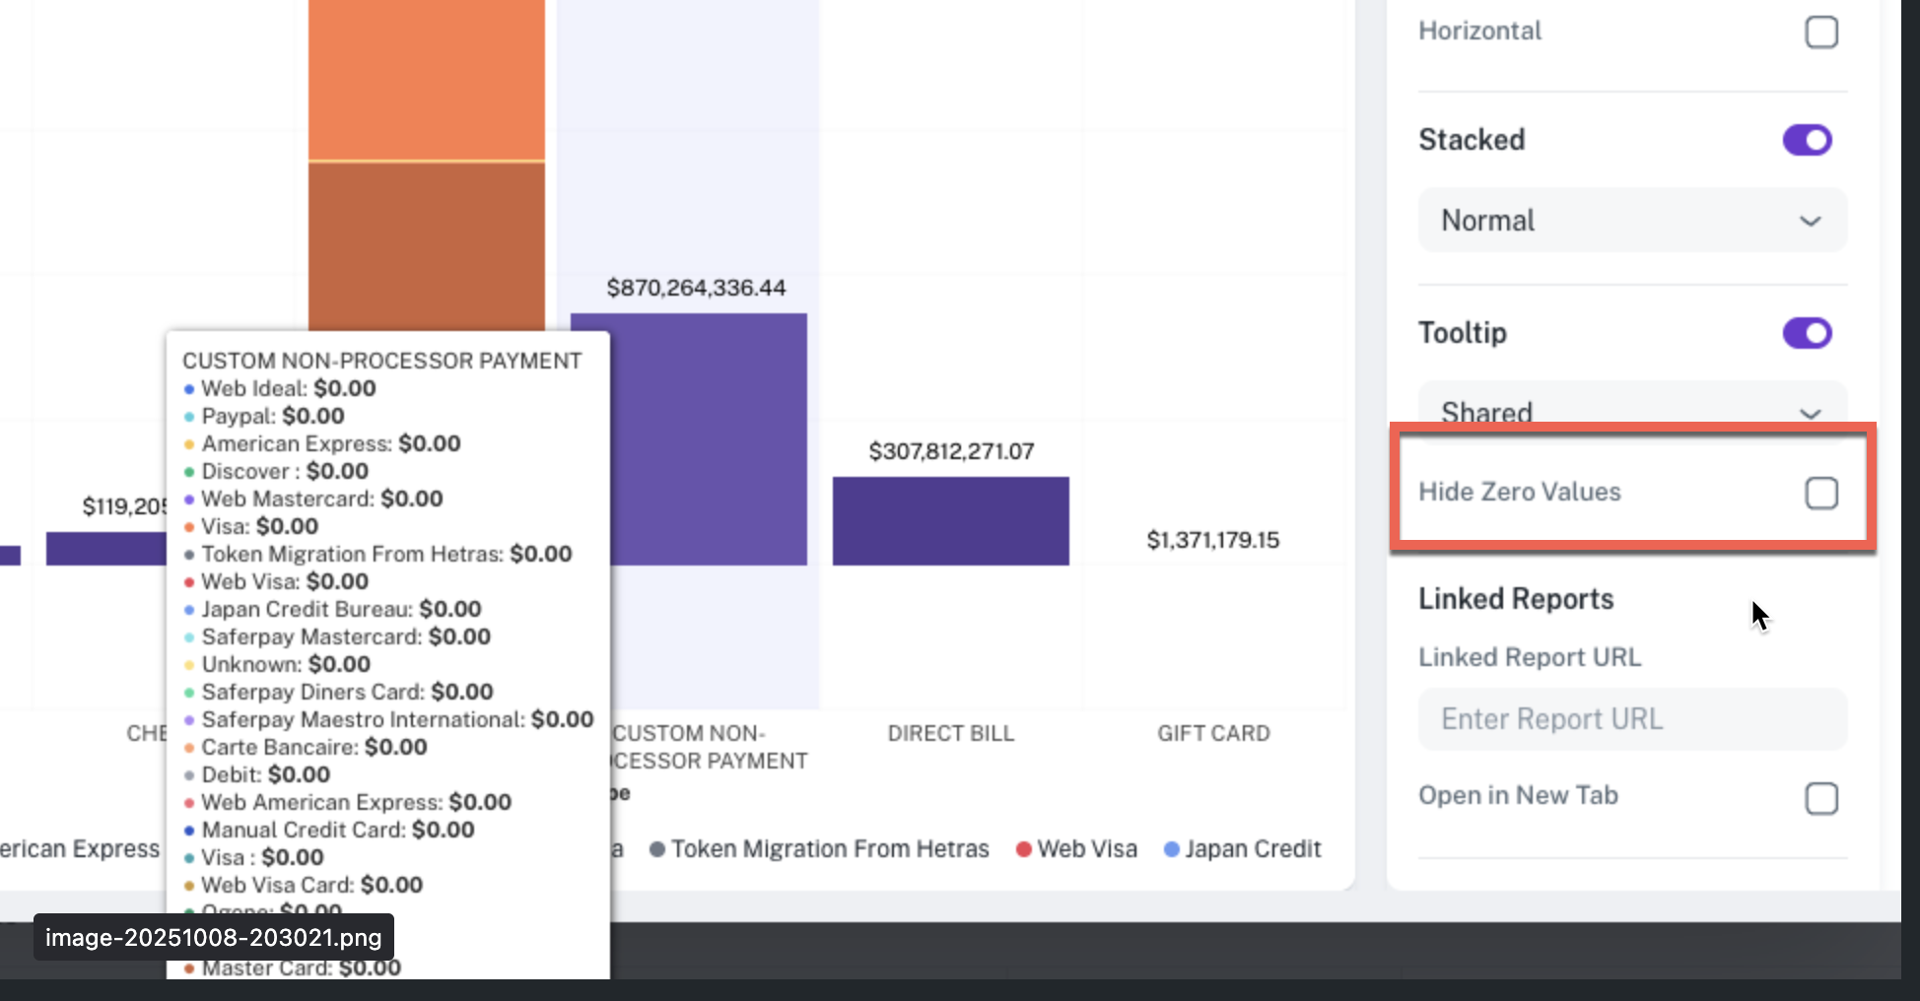
Option to hide or unhide zero values in bar charts: This release provides users with greater control over bar chart visualizations by introducing an option to hide or unhide columns with zero values. This enhancement significantly improves the readability and user experience of complex, grouped bar charts.
-
Customizable display: Previously, categories with a zero value sometimes appeared when hovering over a grouped bar chart, adding visual clutter. You can now toggle a setting to explicitly hide these zero-value columns.
-
Targeted analysis: By hiding columns with a value of zero, your bar charts will become cleaner and more focused, ensuring that interactive states (such as hovering) only highlight categories with meaningful, non-zero data.
-
User preference: This is now a configurable option, allowing you to choose whether to show all categories (including those with zero) or to only display those with positive values, tailoring the chart to your analysis needs.
-
-
Parameter reset option: Introduced a Reset button for individual parameters on the dashboard page. Click the Reset button to instantly revert the parameter to its original default value or state, as it was configured when the parameter was created.
-
Clear all options for Single select/Single line select: Added a Clear All option for single select and single line text parameters directly on the dashboard page.
This feature allows users to instantly remove the current value or selection from these parameter types with a single click. Instead of manually clearing the text input or reverting the single select to its default state, the new Clear All option offers a faster way to reset the parameter and refresh the dashboard view.
-
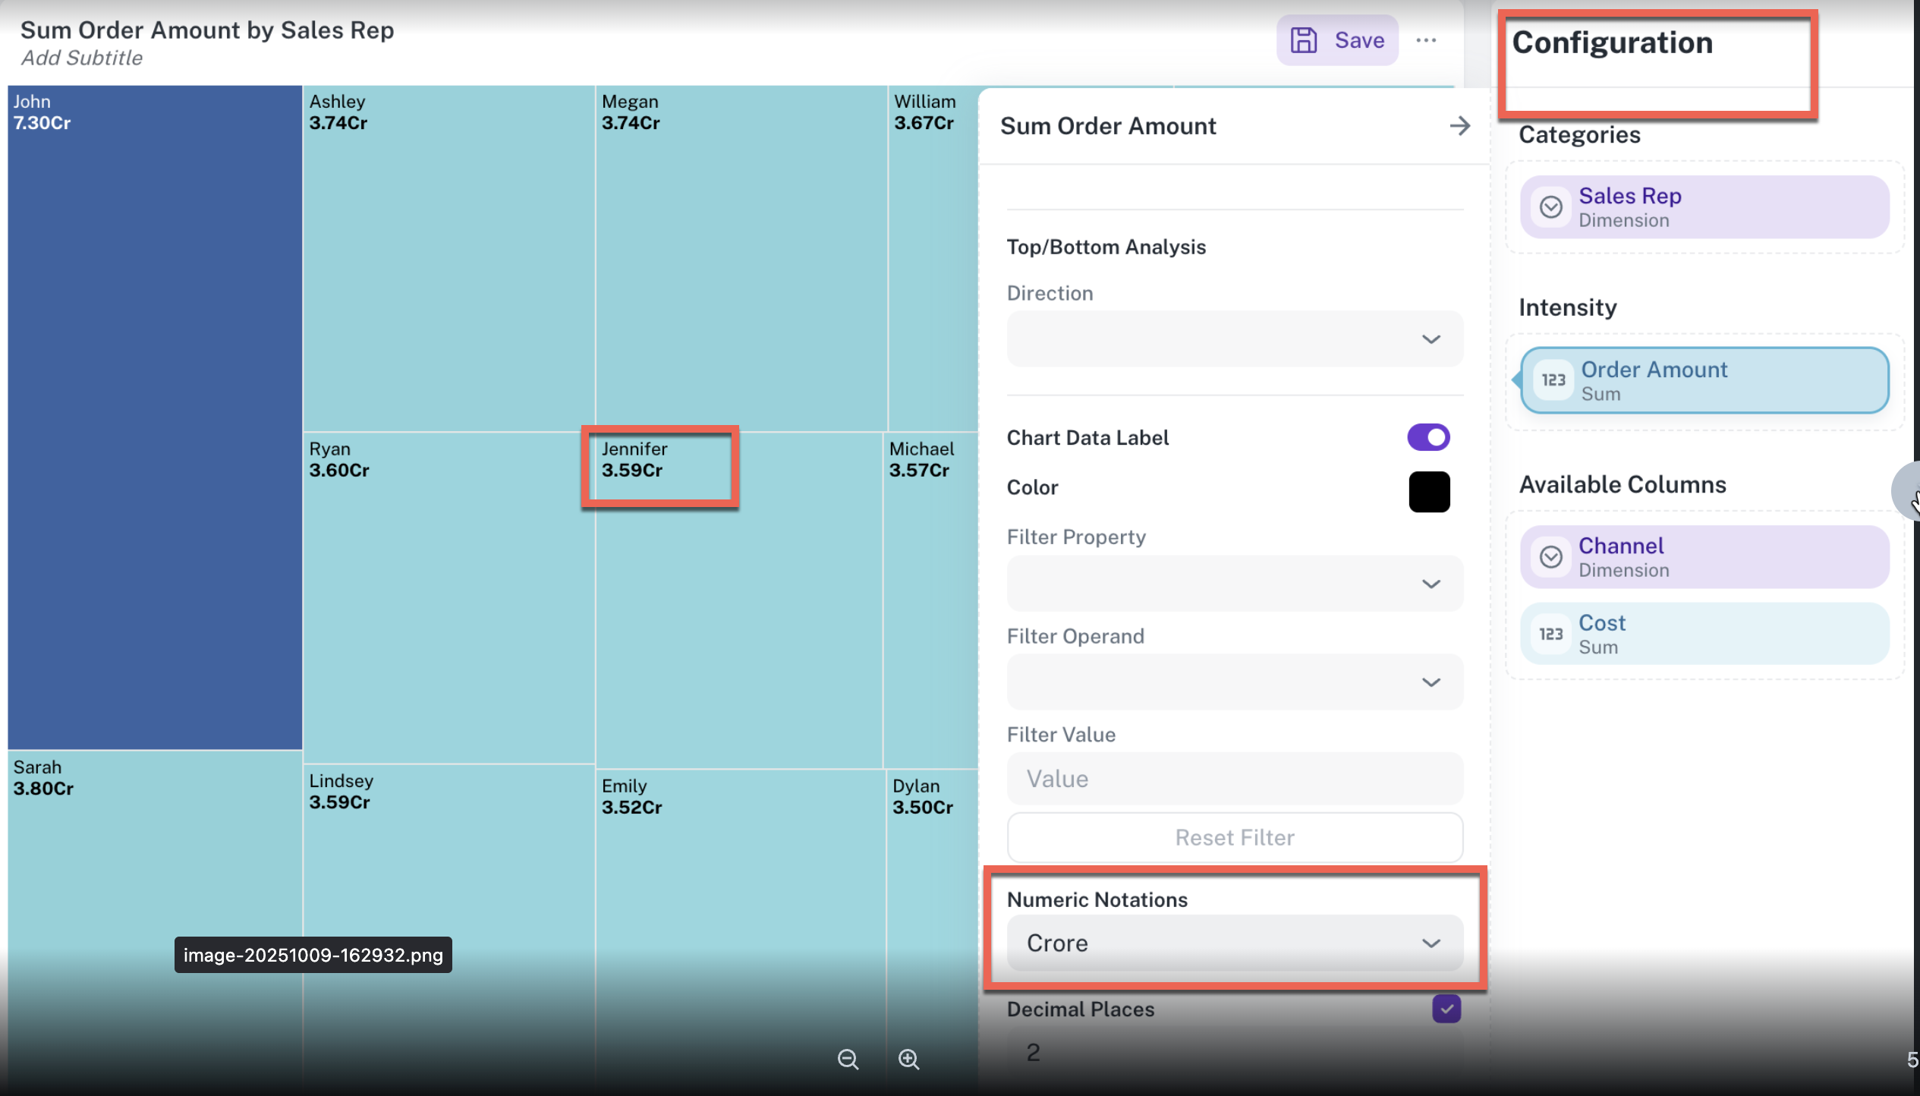
Lakh and Crore display units: You can now select Lakh or Crore as the formatting unit for numbers in your visualizations, which is particularly useful for reporting on large values in financial and business contexts.
UI
Heatmap column formatting for tables: This release introduces Heatmap Column Formatting for table visualizations, a powerful new way to gain immediate visual insights into performance metrics.
-
Visual metric representation: You can now apply a dynamic background color gradient to any numeric column in a table. This feature allows you to instantly see the distribution of values, transforming plain numbers into a vibrant performance map.
-
Performance insight: The initial application of this feature is targeted at key metrics such as Return on Ad Spend (ROAS). A gradient of color will be used:
-
Green or dark shade indicates the highest and best-performing ROAS values.
-
Red or light shade indicates the lowest and underperforming ROAS values.
-
-
Dynamic and relative coloring: The color intensity is calculated dynamically based on the minimum and maximum values currently visible in the column, ensuring the heatmap accurately reflects the range of data being displayed.
-
User configuration: A new setting is available in the table configuration panel, allowing you to select which numeric column to apply the heatmap to, and to customize the Low Color (for example, Red) and High Color (for example, Green) for your gradient.
This feature significantly improves dashboard readability and makes identifying high and low-performing segments faster and easier.
Bug fixes
The following bug fixes are included in this release:
Visualizer and Dashboard
-
Resolved an issue where users were unable to remove Statistics that had been added to a Table widget. The option to delete or clear the statistics configuration is now available, allowing users to manage the widget's display correctly.
-
Dashboard pages displayed irrelevant parameter controls from underlying workbooks even when those parameters are not used by any visible widget, causing clutter. Now the parameter visibility is dynamically adjusted based on widget usage.
Was this helpful?