Viewing the orchestration graph
The Graphs tab within an orchestration provides a clear visual representation of the pipeline's execution order, illustrating the sequence of stages. To view the orchestration graph do the following:
-
On the DataGOL Home page, from the left navigation panel, click Lakehouse > Orchestration.
-
In the Orchestrations page, click the link of an orchestration.
-
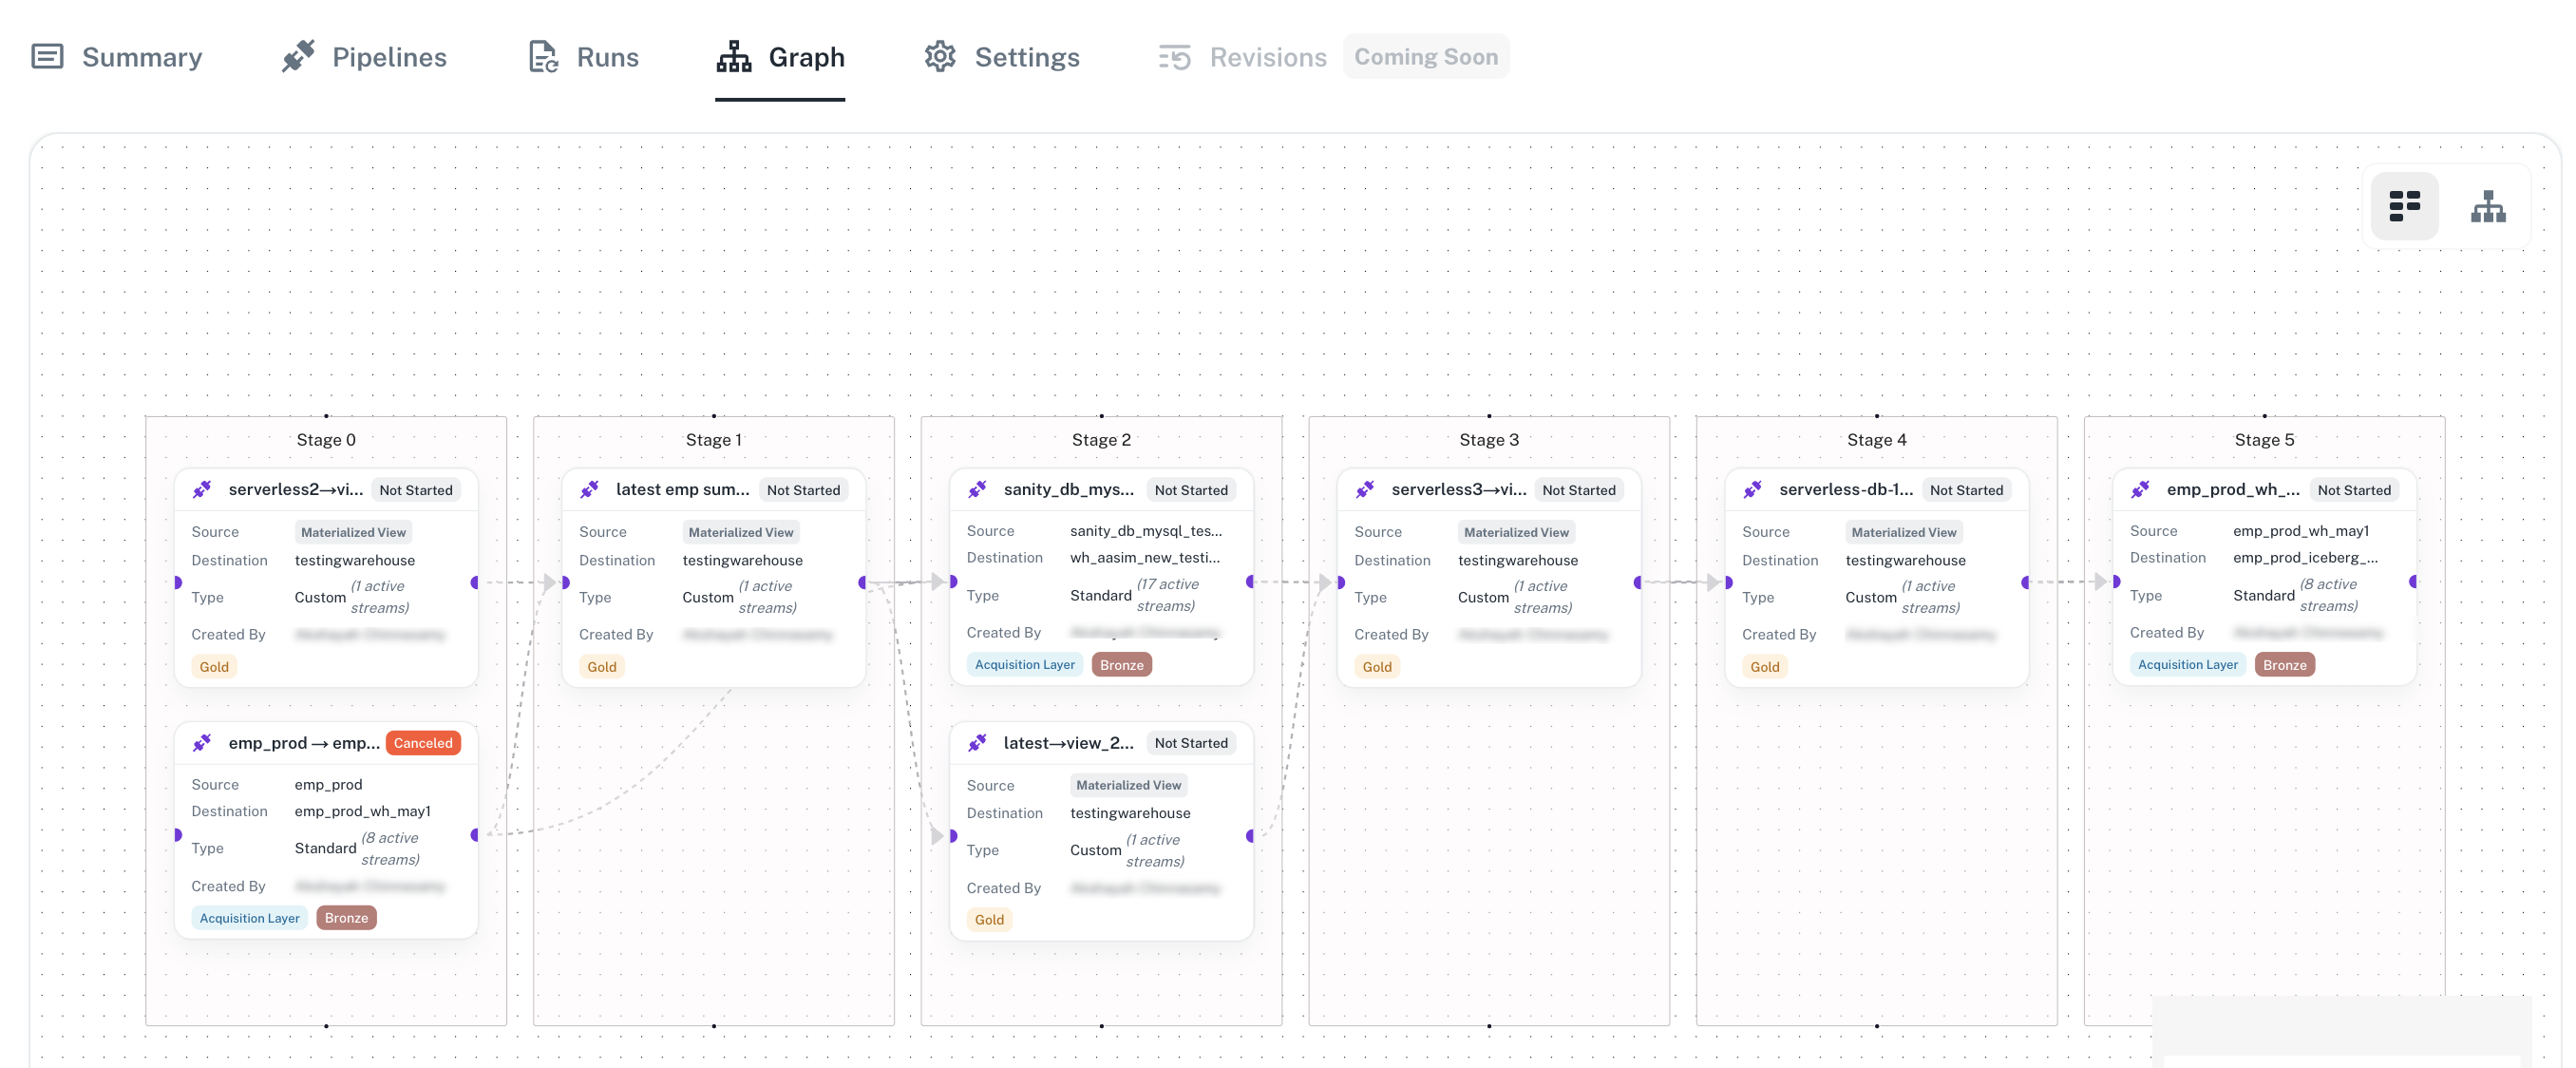
Click the Graphs tab. The stages of the orchestration are listed in a graph. Click any stages to view more details of each pipeline execution.
Was this helpful?