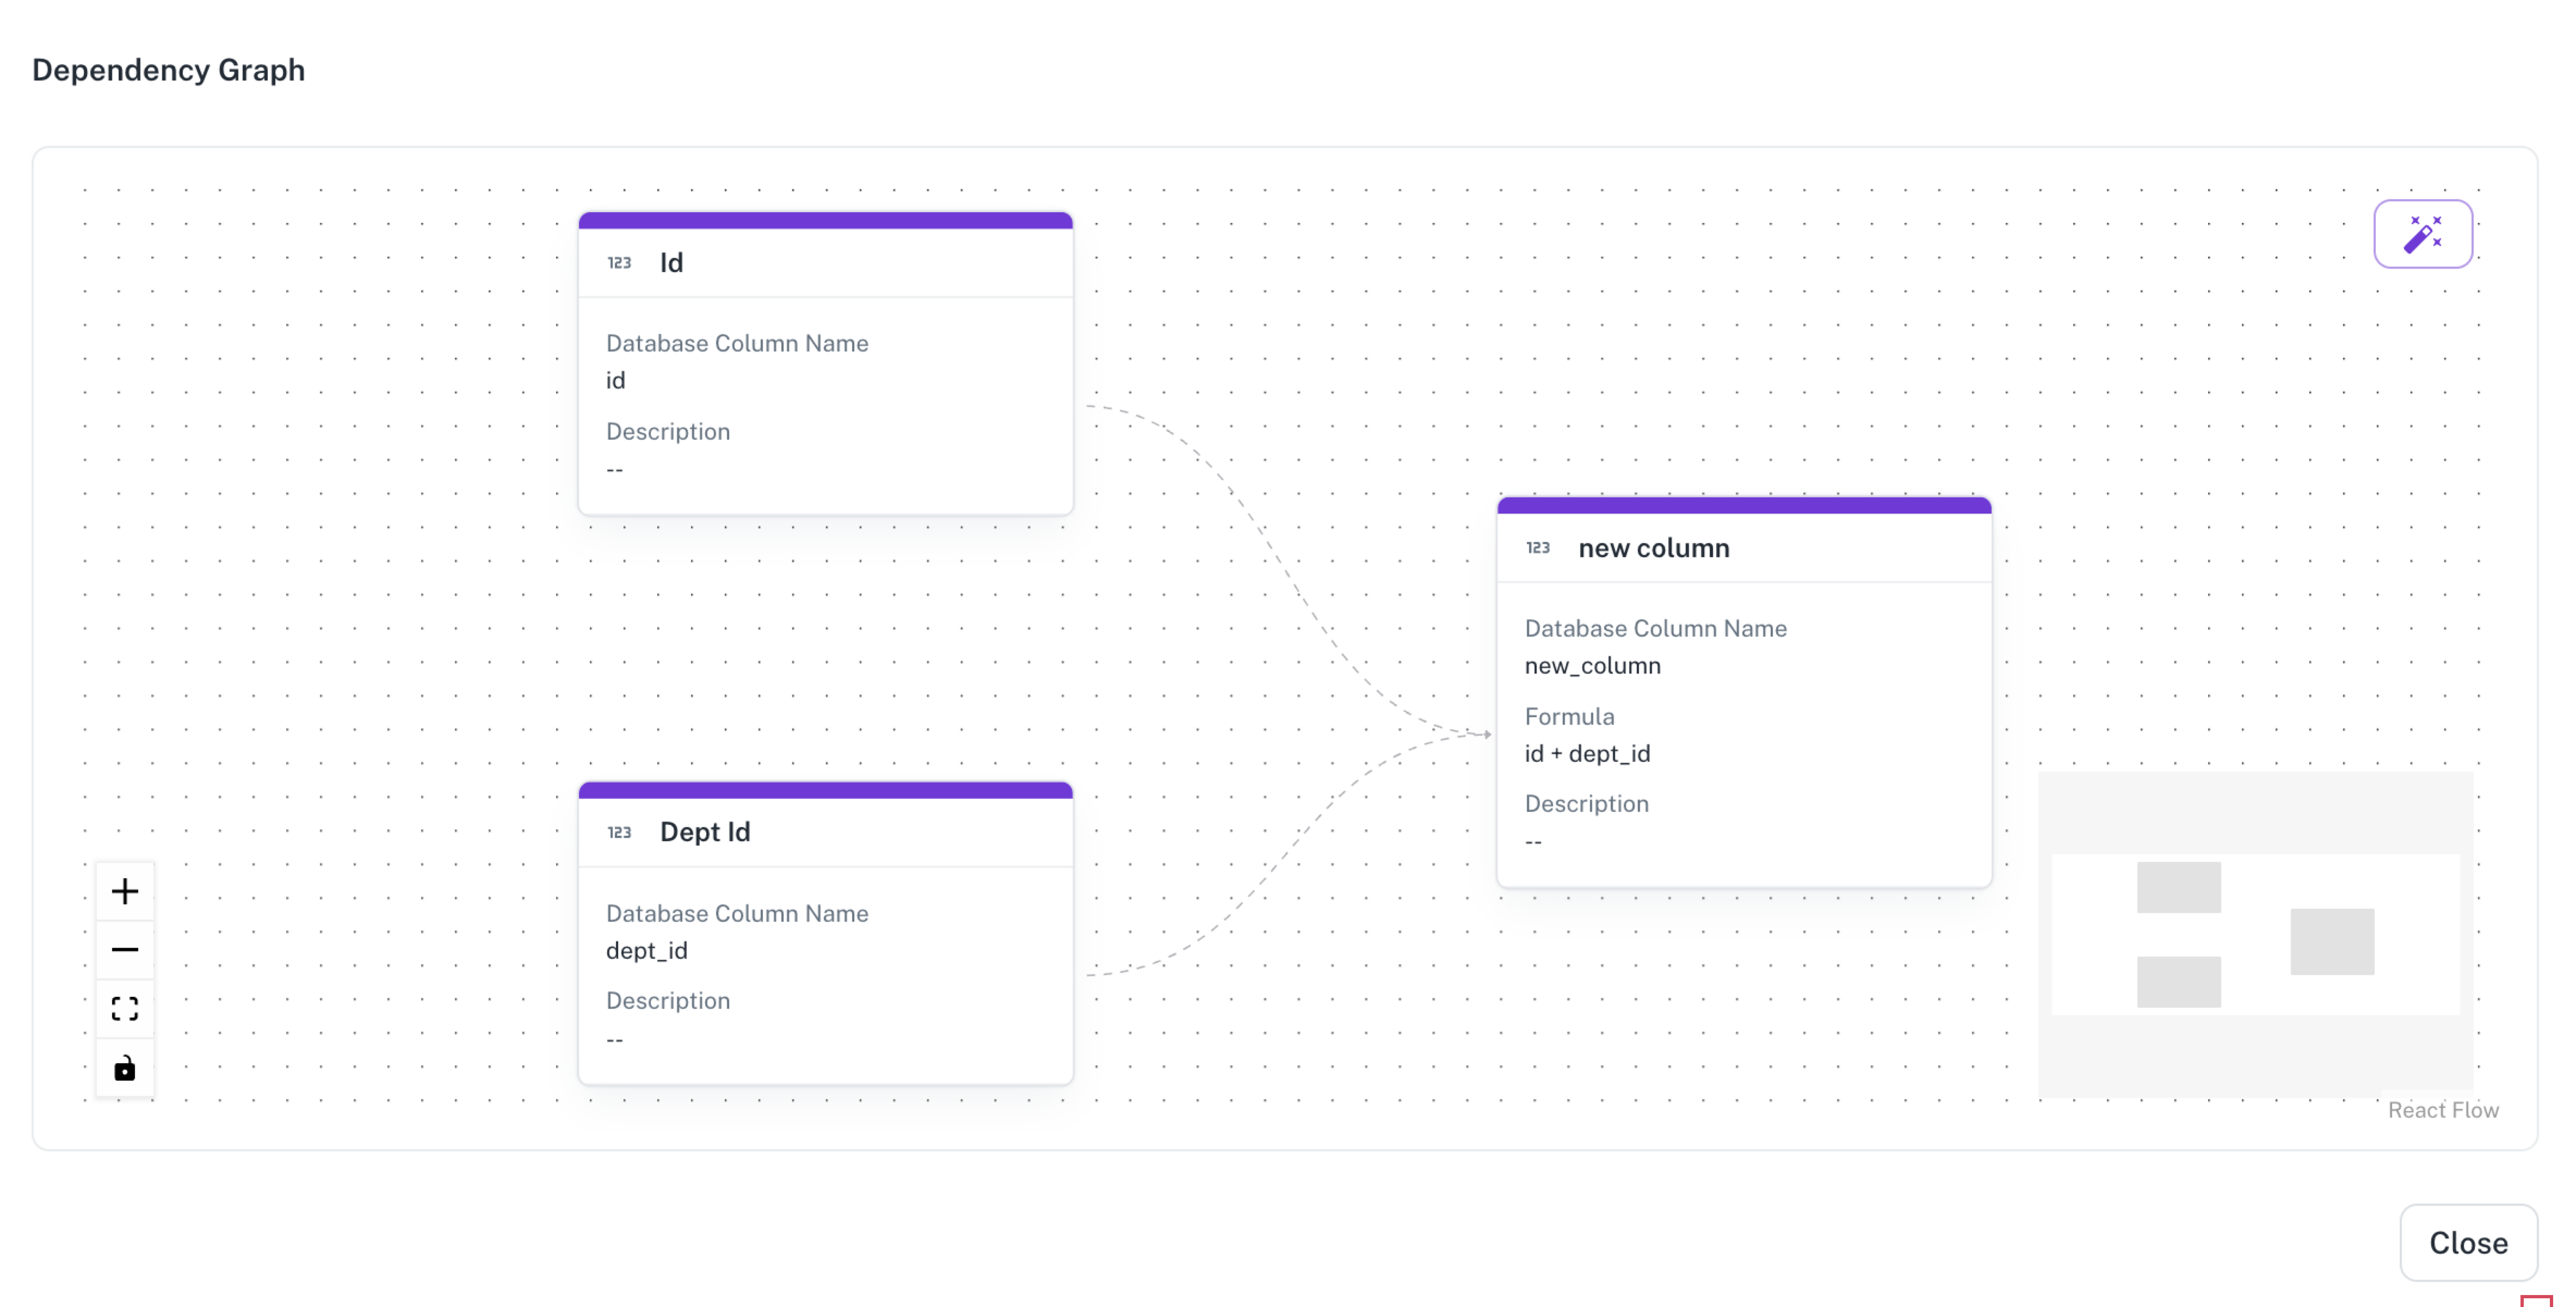
Viewing the column dependency graph
A column dependency graph visualizes how columns are connected through formulas—showing chains where one formula-based column depends on another. It helps identify which columns are safe to delete and allows you to inspect dependencies for any specific column.
-
On the Home page, from the left navigation panel, click Workspace, and from the list of workspaces, open the workspace where the workbook that you want to edit is located.
-
Click the Workbook tab and select the required workbook.
-
Click the Settings button on the top and select Column dependency graph.
Was this helpful?