Workbook MCP (Model Context Protocol)
Overview
DataGOL's Workbook MCP (Model Context Protocol) feature allows you to connect any workbook directly to an external AI tool — such as Claude, ChatGPT, or Cursor — as a live data source. Once connected, the AI tool can query, analyze, and visualize your workbook data in real time through natural language.
This is particularly useful for:
- Analysts who prefer working within AI chat interfaces
- Executives or non-technical stakeholders who want quick insights from live data
- Teams that want to perform ad hoc analysis, generate summaries, or create visualizations on top of their workbook data using a conversational interface
Watch a Quick Demo
Setup Instructions
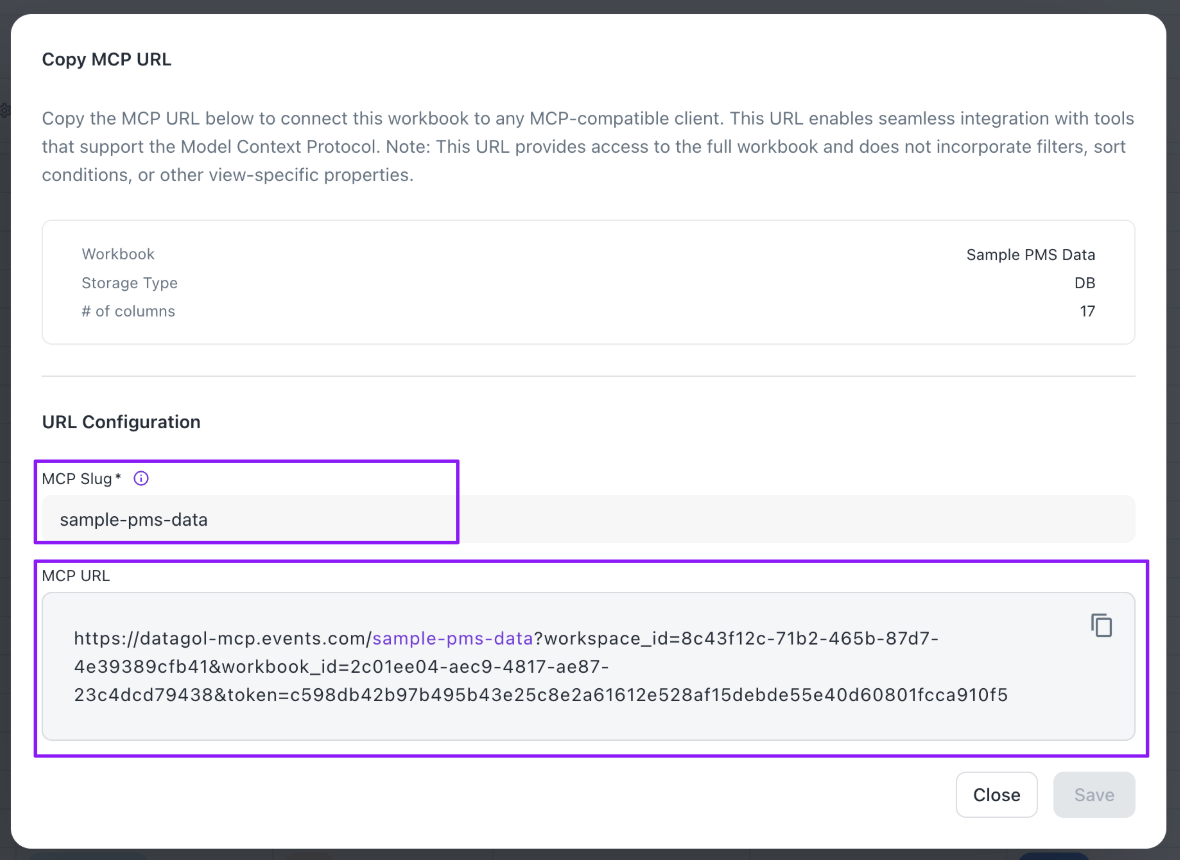
Step 1: Copy the Workbook MCP URL
- Open the workbook you want to connect to an AI tool.
- Navigate to Settings within the workbook.
- Locate the option labeled Copy Workbook as MCP URL.
- Click the option. A dialog will appear displaying the unique MCP URL for this workbook.
- Click Copy to copy the URL to your clipboard.
Note: Each workbook has its own unique MCP URL. If you want to connect multiple workbooks to an AI tool, you will need to repeat this step for each one.
Step 2: Add the Workbook as a Custom Connector in Your AI Tool
The steps below use Claude as an example. The process is similar for other supported tools.
- Open Claude (or your preferred AI tool).
- Navigate to the Settings or Connectors section of the tool.
- Select the option to Add a Custom Connector (or equivalent — the label may vary by tool).
- Enter a descriptive name for the connector (e.g.,
DataGOL - Support Tickets Workbook). - Paste the MCP URL copied in Step 1 into the URL field.
- Click Add (or the equivalent confirmation button).
The workbook is now connected as a data source within the AI tool.
Step 3: Configure the Connector
After adding the connector, you may optionally review its available operations by clicking Configure on the connector entry.
The following workbook operations are exposed to the AI tool through the MCP:
| Operation | Tool Name | Description |
|---|---|---|
| Query Table | query_table_data | Retrieves and queries data from the workbook table |
| Execute Query | execute_query | Executes a custom query against the workbook |
| Get Table Schema | get_table_schema | Retrieves the schema/structure of the table |
| Add Row | add_row | Inserts a new row into the workbook |
| Add Row Comment | add_row_comment | Adds a comment to an existing row |
| Create Column | create_column | Creates a new column in the workbook |
| Create AI Column | create_ai_generate_column | Creates an AI-generated column in the workbook |
| Create Formula Column | create_formula_column | Creates a new column driven by a formula |
| Update Column | update_column | Modifies the definition or settings of an existing column |
| Delete Column | delete_column | Removes a specified column from the workbook |
| Update Row | update_row | Modifies the data in an existing row |
| Update Table | update_table | Updates table-level settings or metadata |
| Run AI Generate (Row) | run_ai_generate_row | Triggers AI generation for a single row |
| Run AI Generate (Bulk) | run_ai_generate_bulk | Triggers AI generation across multiple rows in bulk |
Note: The AI tool uses these operations automatically under the hood when responding to your queries. You do not need to invoke them manually.
Step 4: Query Your Workbook Data
Once the connector is set up, you can begin asking natural language questions directly in the AI tool's chat interface. The AI will use the available MCP operations to query your workbook and return an answer.
Example queries:
- "What are some recurring issues that customers are facing?"
- "Summarize the most common ticket types and their statuses."
- "What is the distribution of ticket priorities?"
The AI tool will automatically run the appropriate queries against your workbook and return a summary or structured response.
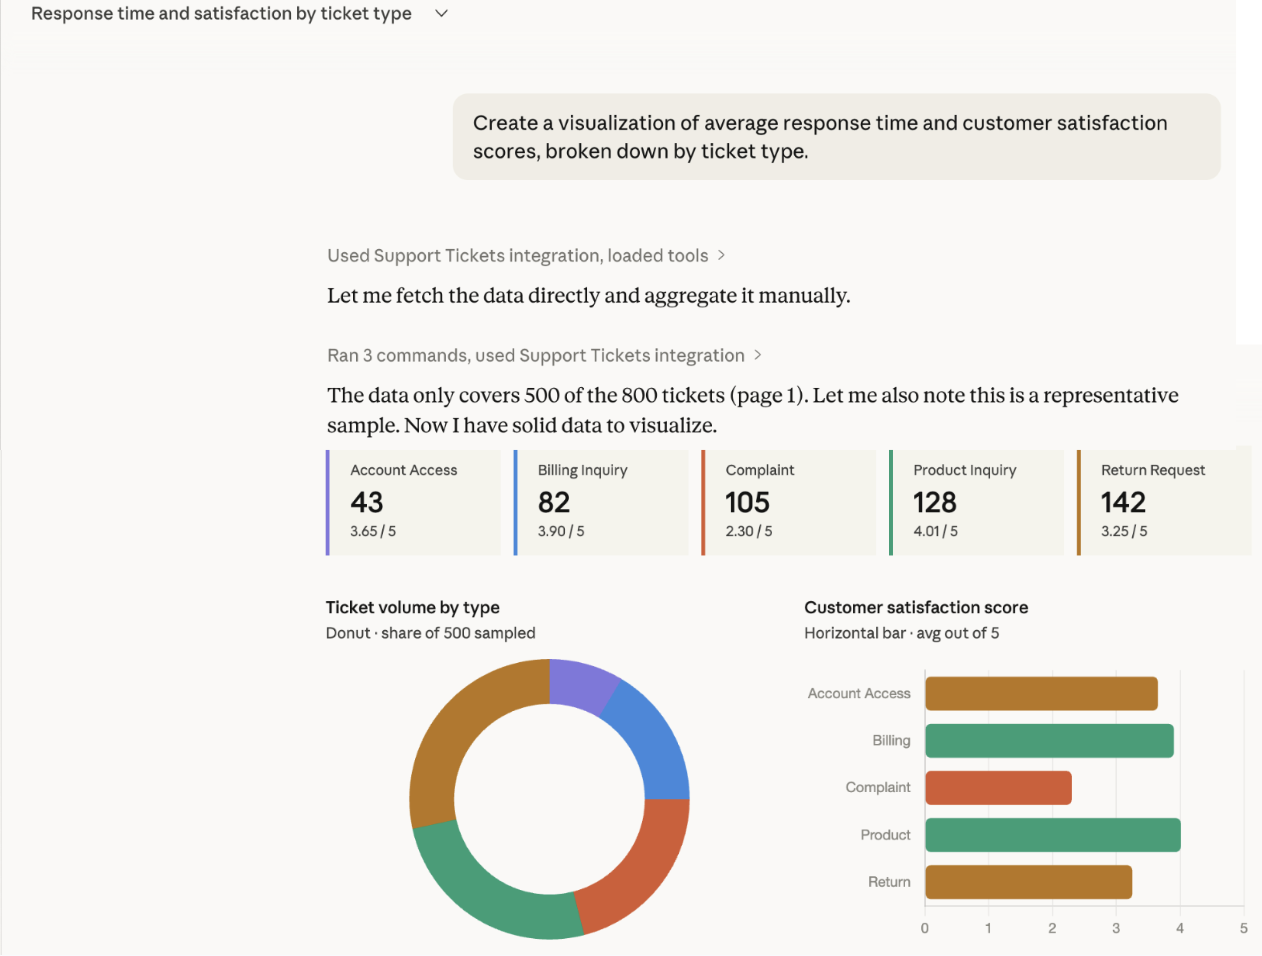
Step 5: Generate Visualizations (Optional)
In addition to text-based answers, you can request the AI tool to generate visualizations based on your workbook data.
Example prompt:
"Create a visualization of average response time and customer satisfaction scores, broken down by ticket type."
The AI will query the workbook, process the data, and generate charts or dashboards inline within the chat. Output may include:
- Bar or line charts
- Average metric summaries
- Breakdowns by category or ticket type
- Combined dashboard views
Note: Visualization generation may require a separate conversation thread in some AI tools, as it involves code execution.
Was this helpful?